Good Health in Region X: Part 3
Tuesday, March 17, 2020, Posted by: Crysta Maniscalco
Written by: Alexcia Devasquez, Data & Information Specialist, NWRPCA
Written by: Alexcia Devasquez, Data & Information Specialist, NWRPCA
This month is National Nutrition Month, honoring which we will conclude our three part series addressing nutrition factors related to health and how we can support the underserved in balancing food inequity.
We have addressed facts regarding America’s under-consumption of fruits and vegetables regardless of an individual’s social determinants of health and USDA’s work to assist in helping people receiving EBT get access to food via delivery. This edition is about the effects on nutritional intake when the body also is processing excess sugars.
According to the USDA, we have enough supply of fruits and vegetables in America for Americans to get their 5 servings of fruits and vegetables a day regardless of geographic and economical barriers. Helping our communities gain access to these foods is an important fight: unfortunately, it is not the only one. One of the things that it can be easy to overlook when considering access to food quantity is access to quality calories and how quality impacts nutritional intake.
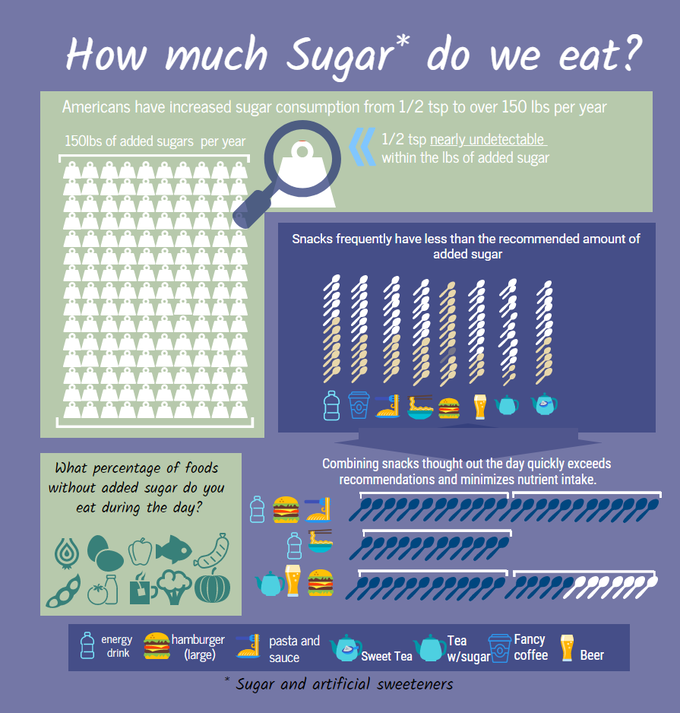
First, let’s take a look back in time and see how our sugar intake has changed. Added sugar consumption has increased from 2 lbs per year per person to 153 lbs per year per person over the last 200 years1. What this translates to, is that we have gone from a ~½ tsp of added sugars a day to 19-42.5 tsp (19tsp = 1/3 cup) of added sugars per day. While the USDA recommends that the added sugar intake be no more than 10% of a 1,000 or 2,000 calorie diet which would be around 12 tsp, the Institute of Medicine found that less than 13% of Americans have a sugar intake of less than 25% while the other 87% of the population has sugar representing more than 25% of their diet2. We struggle in recognizing how much of our diet or caloric intake constitutes processed sugars.
It is not only the lack of nutrients that these meals contain that is concerning, but also, according to The National Health and Nutrition Examination Survey (NHANES), “Nutrient intake was less with each 5% increase in added sugars intake above 5-10%” NHANES found nutrient deficiencies in E, A, C and Magnesium with higher sugar intake. Higher added sugars intakes were associated with higher proportions of individuals with nutrient intakes below the Estimated Average Requirements (EAR), but the overall high calorie and the low quality of the U.S. diet remained the predominant issue. With over 80% of the population at risk for select nutrient inadequacy, guidance may need to focus on targeted healthful diet communication to reach the highest risk demographic groups for specific life stage nutrient inadequacies.2
What I would like to examine further is the idea that there are “snacks” we consume that that almost immediately max out our recommended sugar intake. If we have a few servings of these snacks in a day, we are at that 25% sugar intake. Where do we stand if we have a normal dinner, or other full meals? I wasn’t able to find the lack of nutritional absorption rate that would occur with the increased intake, so I have created this visualization to show the scale.
1 https://www.dhhs.nh.gov/dphs/nhp/documents/sugar.pdf
2 https://www.ncbi.nlm.nih.gov/pubmed/20301013
Data Points Article Good Health Part 1
Data Points Article Good Health Part 2
2 https://www.ncbi.nlm.nih.gov/pubmed/20301013
Data Points Article Good Health Part 1
Data Points Article Good Health Part 2
Region X Telehealth Usage
Friday, April 17, 2020
Written by: Alexcia Devasquez, Data & Information Specialist, NWRPCA
Written by: Alexcia Devasquez, Data & Information Specialist, NWRPCA
In this month’s Data Points, we will look at how many of our FQHCs reported using telehealth in the most recent (2018) UDS report.
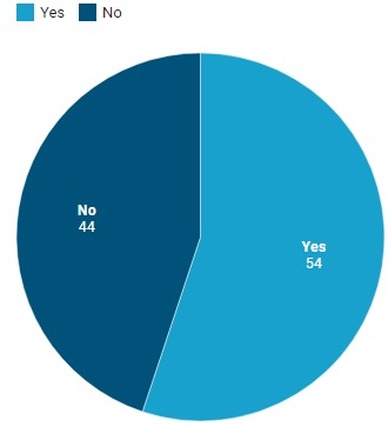
Did your organization use telehealth in order to provide remote clinical care services?
Did your organization use telehealth in order to provide remote clinical care services?
We see more than half of our FQHCs use telehealth as of 2018.
Region X Telehealth Usage
Region X Telehealth Usage
Who did you use telehealth to communicate with? (Select all that apply)
Patients at remote locations from your organization (e.g., home telehealth, satellite locations) Specialists outside your organization (e.g., specialists at referral centers)
Patients at remote locations from your organization (e.g., home telehealth, satellite locations) Specialists outside your organization (e.g., specialists at referral centers)
What telehealth technologies did you use? (Select all that apply)
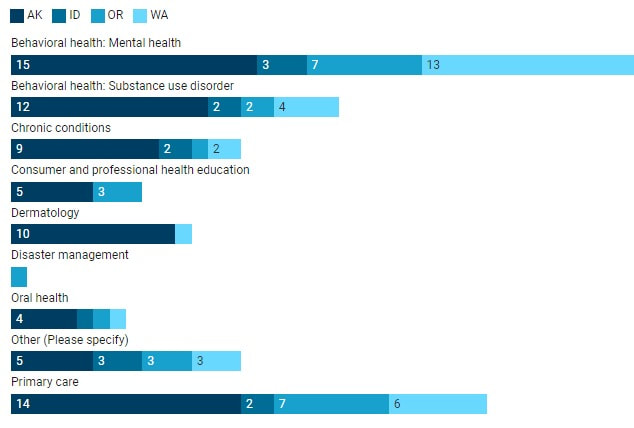
What primary telehealth services were used at your organization? (Select all that apply)
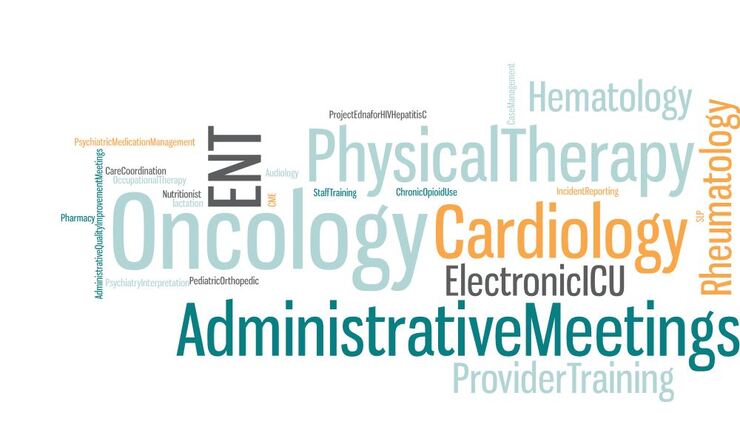
What are the “Other” ways that Region X uses Telehealth?
Has your community health center changed it's telehealth usage in the last 12 months? We would love to hear from you! To fill out our short survey, click here. We value your time, so it will take less than 3 minutes to fill out.
Region X COVID-19 Response
Friday, May 15, 2020
Written by: Alexcia DeVasquez, Data & Information Specialist, NWRPCA
Written by: Alexcia DeVasquez, Data & Information Specialist, NWRPCA
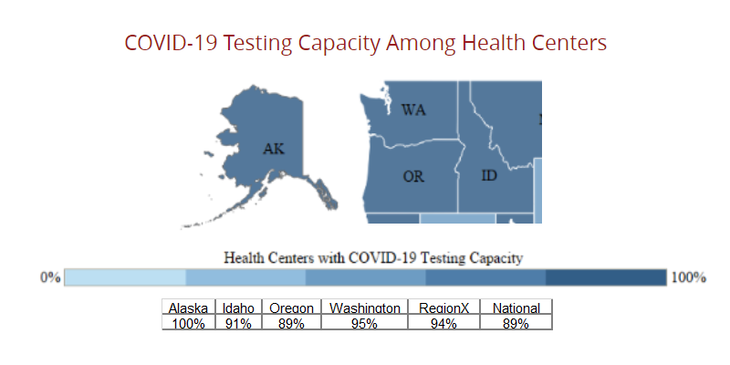
This month's Data Points highlight HRSA's survey data from health centers regarding their COVID-19 response.
Testing capacity in Region X is 94% which is slightly above the National average of 89%. This has increased significantly since April, when the average was 88%.
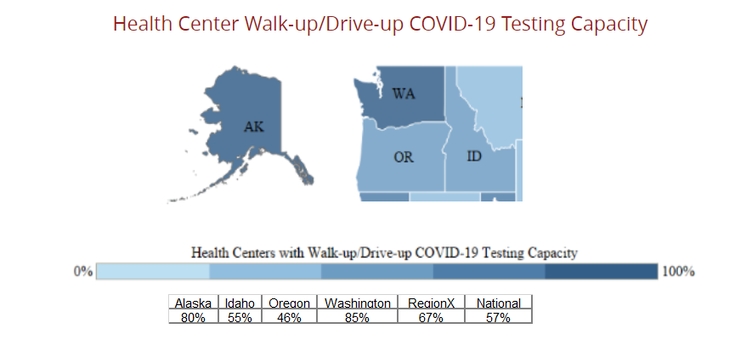
From early April to now, Region X’s ability to provide walk-up/drive-up testing has increased 12%. Region X is a 67% and the National Average is 57%.
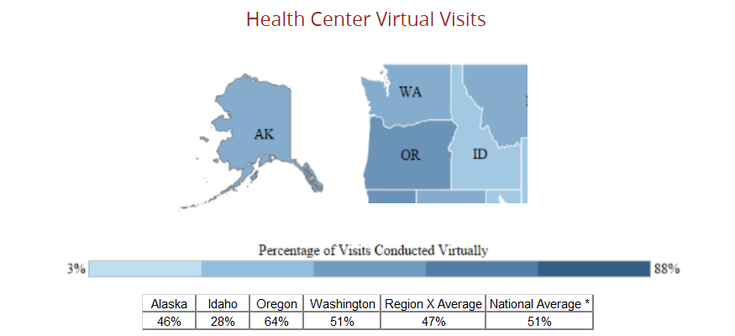
Region X has been using virtual visits to decrease risk of exposure while still being able to see patients. 47% of Region X health centers are utilizing telehealth services while the national average is 51%.
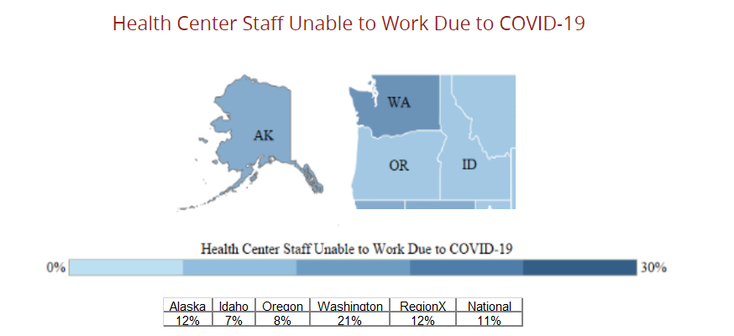
Region X averages for those unable to work is 12% and similar to the national average of 11%, Washington has been greatly impacted by furloughs.
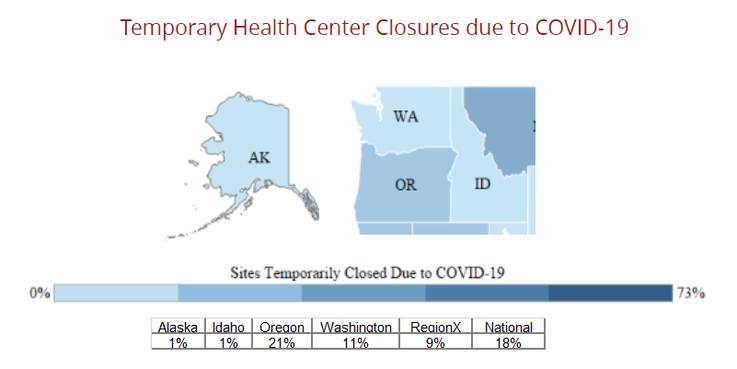
Closures fluctuate as the weeks go by. As some health centers are not able to respond consistently during this difficult time, this remains difficult for Region X to assess the closures. Although the trend does seem to show that there are more health centers responding and fewer health centers have temporary closures.
Source: HRSA Health Center Survey Maps May 8th, 2020
Source: HRSA Health Center Survey Maps May 8th, 2020
Region X COVID-19 Response
Tuesday, June 16, 2020
Written by: Alexcia DeVasquez, Data & Information Specialist, NWRPCA
Written by: Alexcia DeVasquez, Data & Information Specialist, NWRPCA
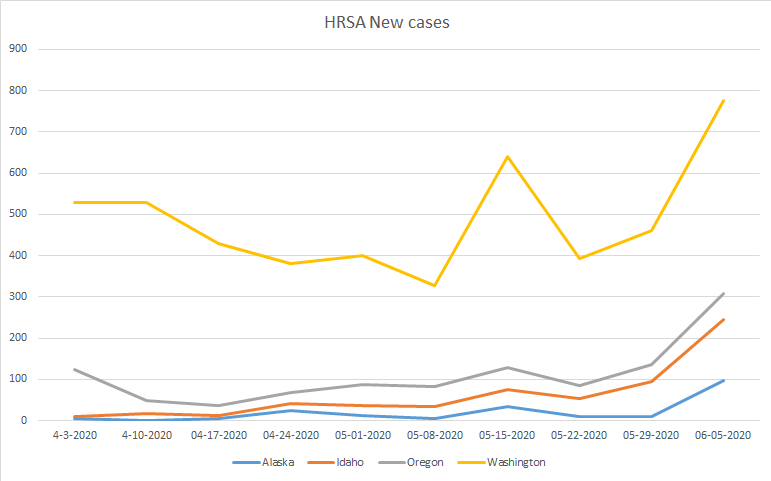
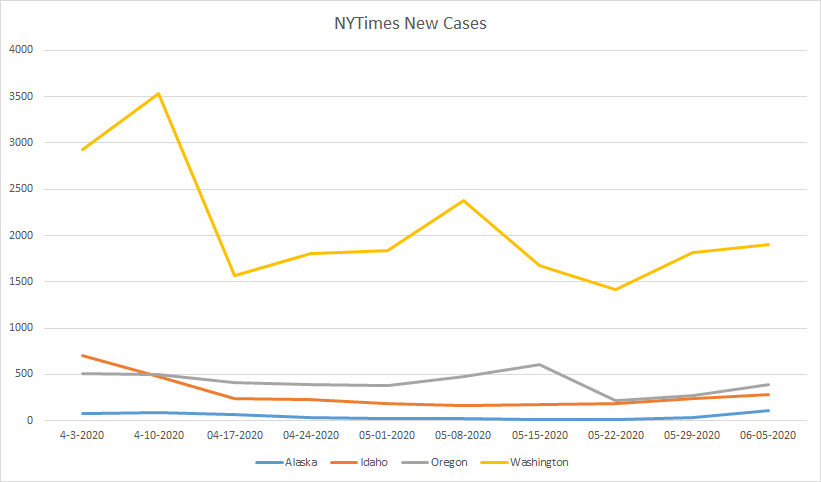
As many of our states start to open up, Data Points would like to examine the COVID infection-rate trends that we see on the state level using data available through the HRSA surveys that our health centers fill out every week and data the New York Times (NYT) has made public through Git Hub.
Over the last ten weeks, we have seen a steady and consistent plateauing of new cases within three of our Region X states (Alaska, Idaho, and Oregon), while Washington shows a decline of new cases being identified from ten weeks ago, but by no means a steady decline or plateau. Washington has seen outbreaks throughout multiple counties including Yakima, which NYT recognizes as a “Hot Spot,” and which shows, on average, 100 new cases per day over the last 7 days.
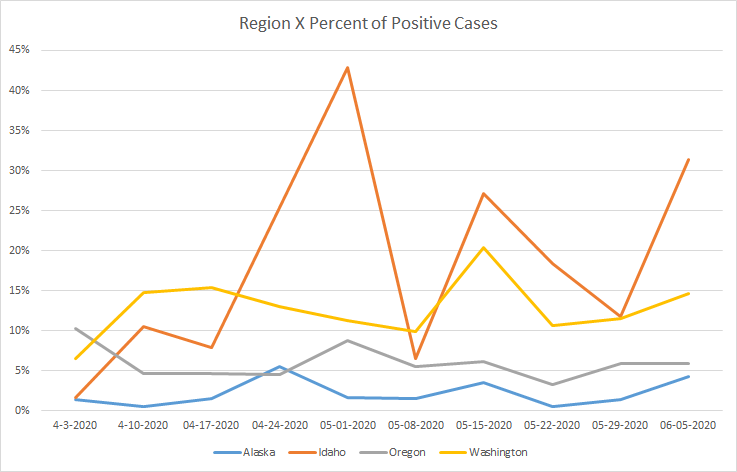
As test accessibility are still a real struggle for health centers in our region, Washington has seen a decrease in the number of tests provided from ten weeks ago, but an increase in the number of positive cases within our health centers. I think this shows that the prevalence of new COVID-19 cases in the subset of our population is increasing.
Our health centers are seeing an increase of new cases after mid-May. As we know, health centers see a different demographic set of patients (a subset) from those that are represented in the National reports of information. NYT’s counts are from laboratories and probable confirmed cases, while our cases are reported from our health centers, which are frequently a different demographic than those who have access to private testing. It is not mutually exclusive, as employers of farmers and other at-risk communities have provided testing to their employees.
What do you suspect are some of the reasons that we see different trends compared to the national average? We would like to provide more information that would be relevant to our Region. Fill out this form to provide your thoughts.
What do you suspect are some of the reasons that we see different trends compared to the national average? We would like to provide more information that would be relevant to our Region. Fill out this form to provide your thoughts.
Despite multiple reports of increased testing and faster testing times, we have not found a collection of national or state reports on the number of testing centers or the availability of drive-up testing, so we are unable to compare this data with national trends at this time.
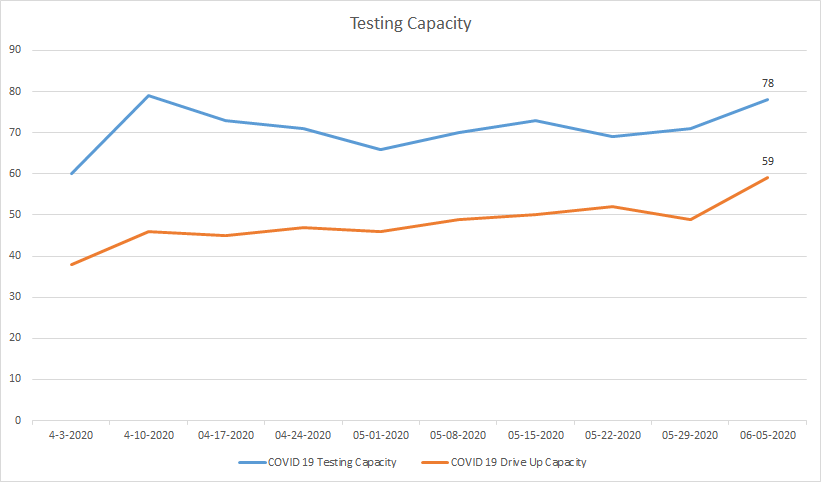
Of the 81 health centers that reported on 6/5/2020, we see that we have 78 health centers that are able to provide COVID-19 Testing; 59 of those are able to conduct drive-up testing. Although not all health centers report weekly and not all the same health centers are able to report, we do see a trend upwards in both testing capabilities and drive-up testing capabilities.
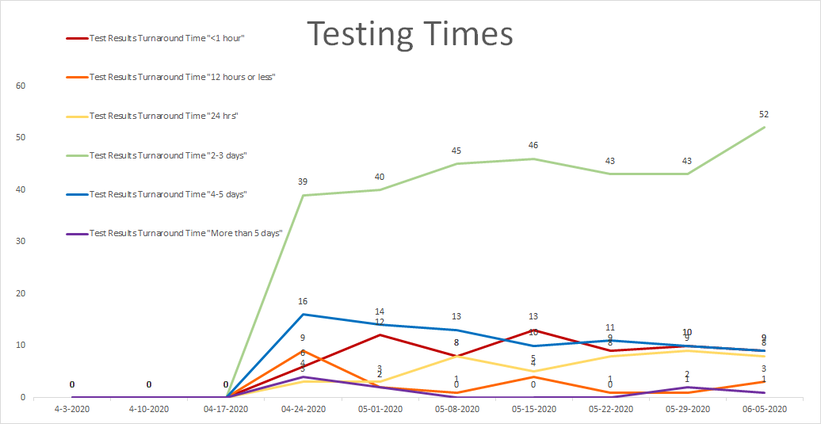
We see about a quarter of our region’s health centers are able to provide testing within 24 hours. The majority (52) health centers are able to provide results within 2-3 days and a few have longer turnarounds.
Sources:
New York Times Git hub: https://github.com/nytimes/covid-19-data
NWTimes out break information: https://www.nytimes.com/interactive/2020/us/coronavirus-us-cases.html
Sources:
New York Times Git hub: https://github.com/nytimes/covid-19-data
NWTimes out break information: https://www.nytimes.com/interactive/2020/us/coronavirus-us-cases.html
Possible Implications for Lingering Effects of COVID-19 in Region X FQHCs
Tuesday, September 15, 2020
Written by: Alexcia Devasquez, Data & Information Specialist, NWRPCA
Written by: Alexcia Devasquez, Data & Information Specialist, NWRPCA
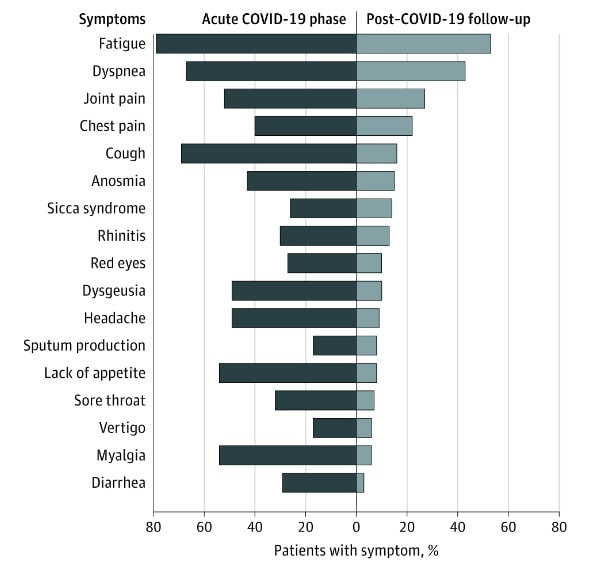
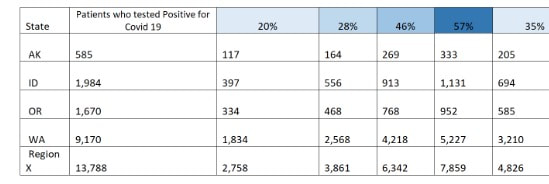
According to Tenforde et al., we know that 60 days after illness, 55% of patients with acute cases of COVID-19 had three or more symptoms.
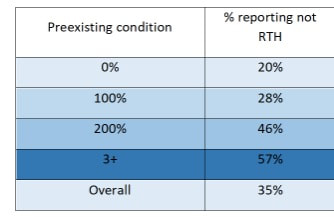
We see that similar findings are found by Carfì et al. regarding patients without acute cases when they describe retuning to health (RTH). They found that 95% of patients showed symptoms at testing and 35% of those showed one or more symptoms 16 days after testing. When exclusively looking 18-34 year olds without pre-existing conditions, 20% had not returned to health. When looking at patients with preexisting conditions, they reported 57% of those with 3 or more preexisting conditions had not returned to health 16 days later.
From April 3rd to August 21st, Region X FQHCs have tested 13,788 patients. Below, we can see possible impacts in Region X using these rates. Are you seeing this phenomenon at your health center?
Screening in Region X for Social Risk Factors
Friday, October 16, 2020
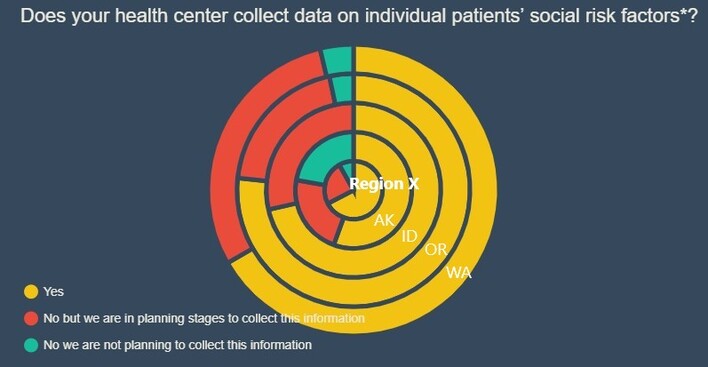
Recently HRSA released the most recent UDS reports that were submitted earlier this year, which has included information that Region X FQHCs provided about social risk factor screenings. In the Health Information Technology Section UDS asked the question: “Does your health center collect data on individual patients’ social risk factors, outside of the data reportable in the UDS?”. This question was multiple choice and shows us who is already asking screening questions, who is planning on it, and who is not planning on it.
As of December 31st 2019, two-thirds of Region X FQHCs already screen patients for social risk or social determinants of health. 24% said that they were planning on collecting this data, with 9% of these respondents providing a survey they were planning on using. Eight FQHCs (8% of the region) stated that they did not have plans on doing screening nor do they have a screener on staff.
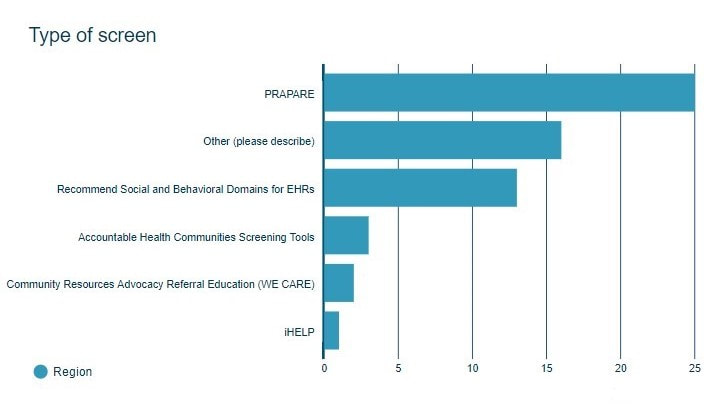
Of the health centers that indicated that they do social risk factor screening, the following shows the tools used:
Of the health centers that indicated that they do social risk factor screening, the following shows the tools used:
2020: The Changing Virtual Landscape
Friday, November 13, 2020
Written by: Alexcia DeVasquez, Data & Information Specialist, NWRPCA
Written by: Alexcia DeVasquez, Data & Information Specialist, NWRPCA
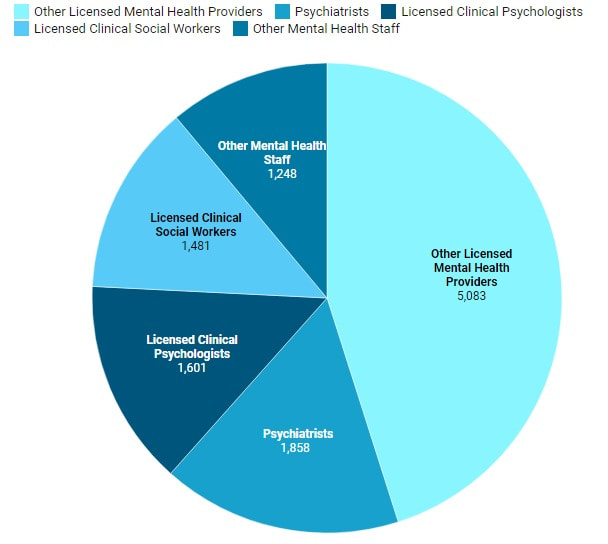
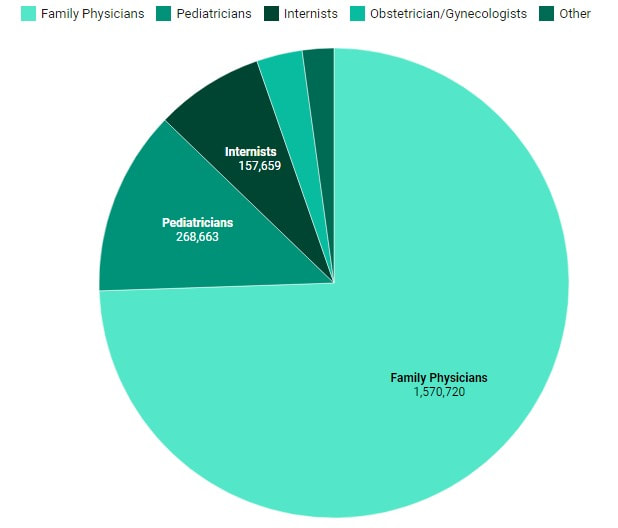
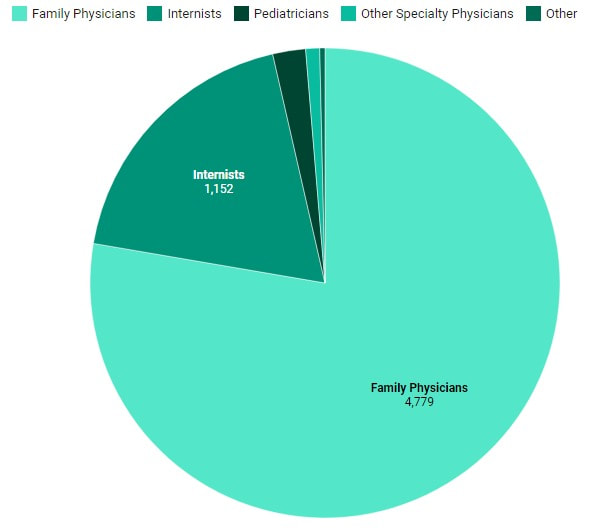
In 2019, UDS reports show that less than 1% of FQHC visits were done virtually. We saw the most of virtual visits being among Psychiatrists at 4.12% of their visits being virtual. Licensed Clinical Psychologists did 1.93% of their visits virtually.
Mental Health Clinic Visits 2019
Mental Health Virtual Visits 2019
Physicians Clinic Visits 2019
Physicians Virtual Visits 2019
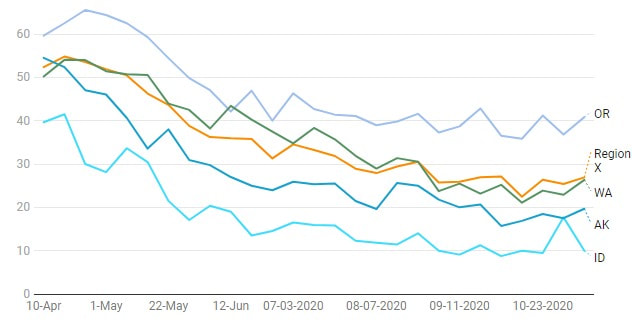
In early 2020, looking at the HRSA COVID-19 Survey, we see that health centers had over 50% of visits happening virtually in Region X, with up to 65% virtual visits in Oregon. As lockdowns restrictions eased, we saw the percentage of virtual visits reduce, with more people going into the clinics for visits. The end of October saw an increase in restrictions due to increases in numbers of cases. You can see this reflected in the uptick of virtual visits. This coming week, three of our four states will be implementing new lockdown restrictions, while Idaho implemented newer restrictions on Oct 26th. We will continue to publish information as it becomes available.
2020: Dental and Mental Health and FQHC Growth
Tuesday, December 15, 2020
Written by: Alexcia DeVasquez, Data & Information Specialist, NWRPCA
Written by: Alexcia DeVasquez, Data & Information Specialist, NWRPCA
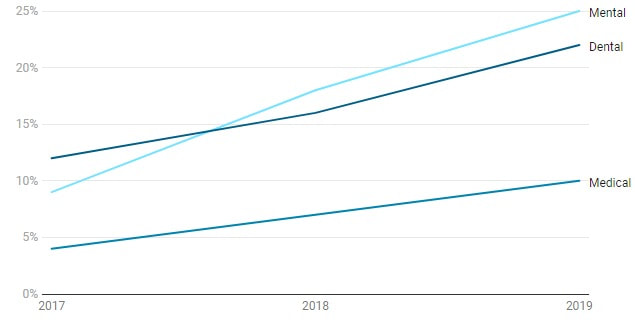
In 2019, mental health visits consisted of 21% of patient encounters in Region X. Although this is only a small increase of .06% from the year before, mental health encounters have increased 25% over the last four years while our medical encounters have increased 10% over the last 4 years.
Percentage Growth of Encounters Since 2016
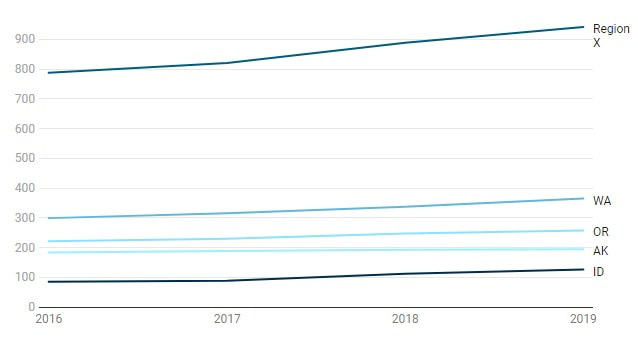
We have seen a 20% growth with the addition of 154 sites over the last four years.
Number of FQHC Sites - 2016- 2019
Number of FQHC Sites - 2016- 2019
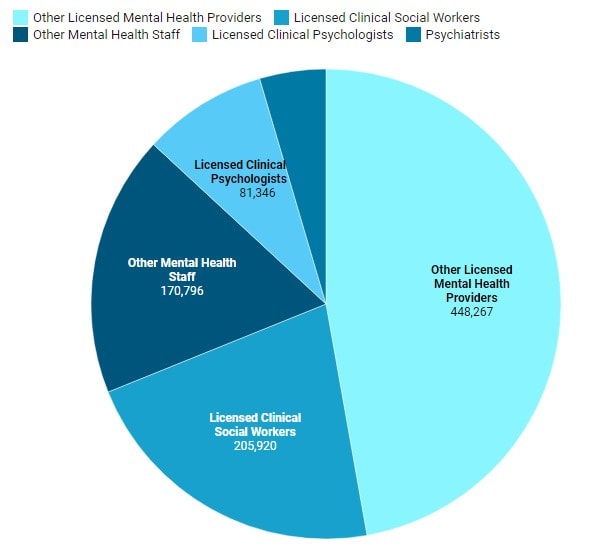
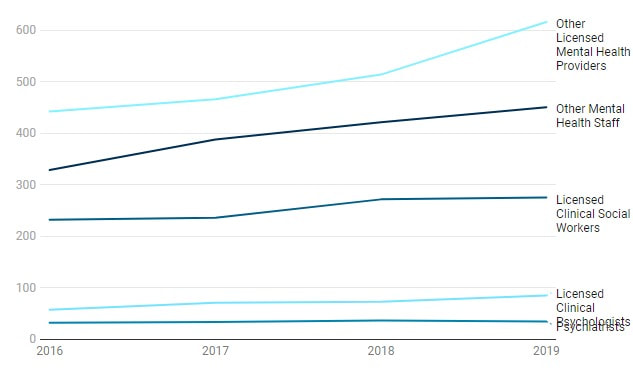
It looks like the increased number of mental health visits are being provided by Other Mental Health Providers and other Mental Health Staff.
Mental Health - Staffing 2016-2019
Mental Health - Staffing 2016-2019
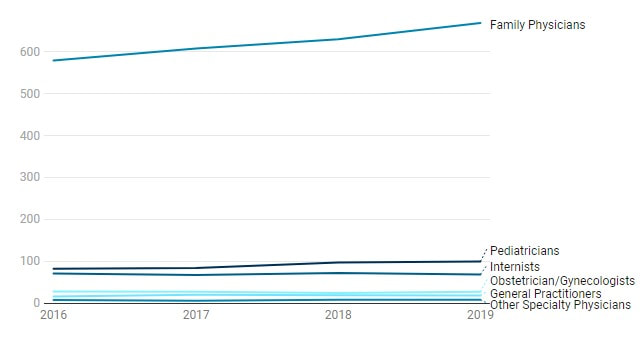
Numbers of physicians as staff has also grown slowly compared to the number of encounters. We are lead to believe that FQHCs are focusing their growth on both mental and dental capabilities in their health centers.
Physicians 2016-2019
Physicians 2016-2019

