Highlights from the NWRPCA 2018-19 Region X Salary and Benefits Survey
Monday, January 14, 2019
Posted by: Thomas Johnson
Posted by: Thomas Johnson
Last month, NWRPCA released the 2018-19 Biennial Region X Health Center Salary & Benefits Survey. Fifty-two health centers throughout Alaska, Idaho, Oregon, and Washington participated in the data collection process by submitting salary and benefits information for their entire staff. The final report includes:
- Compiled salary and benefits for 124 different health center positions
- Breakdowns for key positions by state, year of service, and health center size (according to budget)
- Summaries of employee benefits packages offered throughout the region (e.g. insurance types, retirement options, employee leave)
- Staff turnover and point-in-time vacancy information (e.g. vacancies, recruitment length)
Salaries are on the rise for most positions
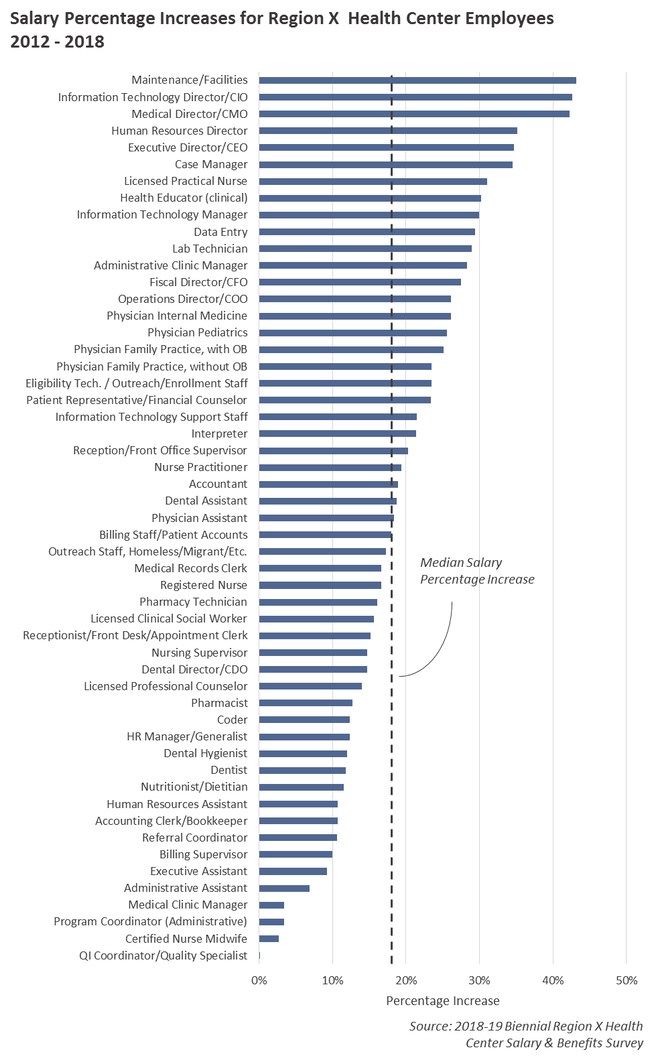
Since 2012, the average health center position has seen an increase in salary by about 18%. This increase is not, however, evenly spread across the different staff types. Maintenance and facilities staff, for example, are on average paid 43% more today than they were in 2012, while QI Coordinators have seen virtually no change in compensation.
Most health centers offer employees some form of additional pay
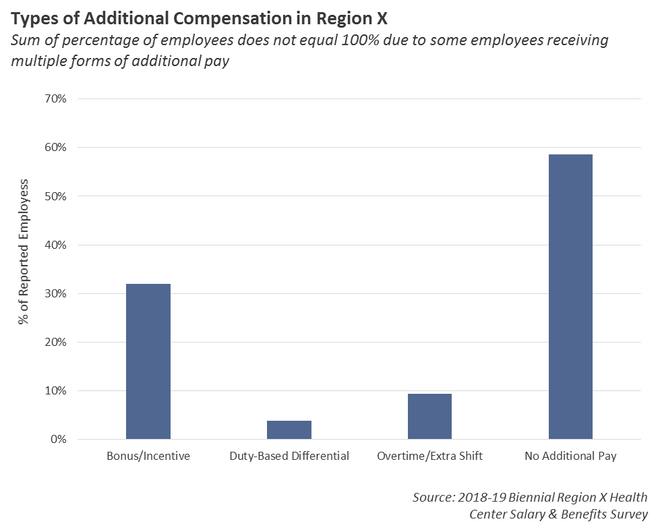
69% of all health centers that participated in the data collection process indicated that they provided employees with some sort of additional pay. Of all the employee records that were submitted, 41.4% indicated that they received one or more forms of additional pay, including bonuses/incentives, differentials based on duties, or overtime/extra shifts.
69% of all health centers that participated in the data collection process indicated that they provided employees with some sort of additional pay. Of all the employee records that were submitted, 41.4% indicated that they received one or more forms of additional pay, including bonuses/incentives, differentials based on duties, or overtime/extra shifts.
Most health centers offer employees generous benefits packages.
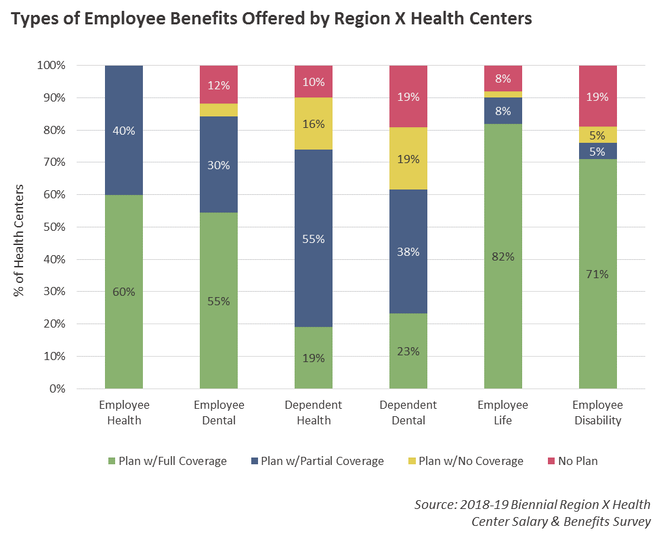
Most health centers who participated in the survey offer employees full or partially covered health and dental insurance. A majority also provide coverge for dependent health and e, however the number of health centers that do not offer dependent coverage (or do not offer any plans) is also greater. Finally, an overwhelming majority offer fully covered options for disability and life insurance.
Most health centers who participated in the survey offer employees full or partially covered health and dental insurance. A majority also provide coverge for dependent health and e, however the number of health centers that do not offer dependent coverage (or do not offer any plans) is also greater. Finally, an overwhelming majority offer fully covered options for disability and life insurance.
Community Health Centers by the Numbers: An Interactive Crash Course
State Profiles: Medicaid Patients and FQHCs in Region X
Monday, June 17, 2019
Posted by: Thomas Johnson
Posted by: Thomas Johnson
In the last data points article, we toured the relationship that exists between health center patient revenue and Medicaid. This month, we will look more broadly at the Medicaid programs that exist in each Region X state, and review how their policies impact health center operations.
Federal Policy
Before diving into the specifics of each state, however, it’s important to review some of the policy implications set at the Federal level. Medicaid is a public insurance program operated and funded by state-run health departments, with additional funding and oversight provided from the federal government. This means that policymakers at both the federal level and the state level have a broad impact on how Medicaid functions, what it covers, and who is eligible.
The Patient Protection and Affordable Care Act (ACA) has had a significant impact on Medicaid eligibility and enrollment. Originally, the law required that all states expand their Medicaid programs to adults with incomes up to 138 percent of the federal poverty line. The purpose of this requirement was to eliminate the coverage gap that would otherwise exist for adults that were not eligible for Medicaid or health insurance subsidies (another component of the law). To help states fund the expansion, the Federal government agreed to pay for the overwhelming majority of the costs associated with the new enrollees.
In 2012, the Supreme Court ruled that the requirement to expand Medicaid was unconstitutional, thereby making it optional for states to expand their programs. To date, most states have taken measures to expand Medicaid, although the paths taken have varied from state-to-state. Many (including Oregon and Washington) passed expansion legislation in 2014 to take advantage of the additional Federal funding. Others expanded their programs at a later date (like Alaska). In other states, expansion was delayed due to lengthy disputes between different branches of government (Maine), or only after the voters mandated by referendum that their governments expand their program (Idaho).
Since taking office, the Trump administration has shifted efforts away from increasing Medicaid enrollment, voicing concerns over increased costs, and federal policymakers are currently exploring options that would ultimately cut funding and reduce enrollment. In 2018, CMS invited states to submit proposals (in the form of 1115 waivers) to impose work requirements on Medicaid enrollees, which would cause an estimated 1.4 to 4.0 million adults to lose coverage. So far, eight states have had their work requirements approved by CMS, although a federal judge has blocked efforts in Arkansas and Kentucky. Federal policymakers have also renewed interest in funding Medicaid according to block grants. Currently, Medicaid funding operates as an entitlement program where the amount of federal dollars provided to each state varies according to program need and per capita income. As the number of Medicaid enrollees increases, the amount provided by the federal government to states also increases with no pre-set limit. Under a block-grant model, the amount of money provided to states would be capped at a set amount. This would make funding more predictable for Congress and give states more flexibility in how they operate their program, however it would also most likely force states to establish policies that keep enrollment under a set amount.
Medicaid Reimbursement for Health Centers
Because both programs aim to ensure access to health care for individuals who otherwise are unable to afford it, there is an overlap in values and motivations between the Health Center program and Medicaid. More than 50% of all patients served by health centers in Region X (Alaska, Idaho, Oregon, and Washington) are covered by Medicaid.
To ensure that health centers receive adequate reimbursement for care provided to these patients, health centers and Medicaid have a special relationship that governs how much revenue they receive. Unlike with other types of payers (like private insurers), rather than receive payment for individually billed services, health centers are paid a formula-determined encounter fee for delivering care to Medicaid patients. The encounter fee typically covers all qualified services, although in some cases health centers may bill Medicaid for additional services not covered. Known as the Prospective Payment System (PPS), the purpose of this reimbursement model is to prevent health centers from having to use grant funding to cover the cost of care for Medicaid patients.
In ideal scenarios, a health center's PPS rate is set to approximate the average cost of care for that health center. States have the flexibility to adjust health center PPS rates, however, depending on changes that have occurred since when the rate was first calculated. In some cases, this may backfire for health centers, resulting in lost revenue due to miscalculated adjustments.
Alaska
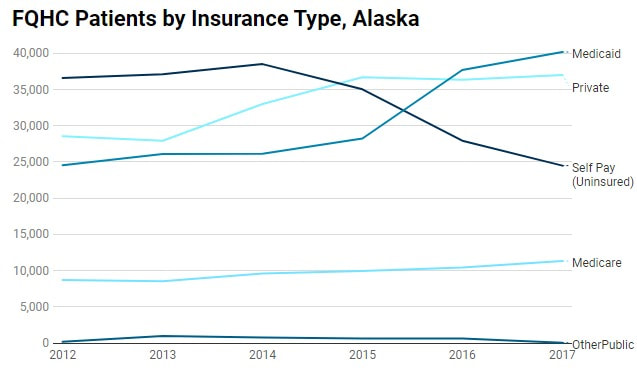
In 2017, 200,369 Alaskans were enrolled in Medicaid. 40,178 (20%) of those patients went to a health center. The western part of the state has the higher incidence of Medicaid patients, with more than 50% of the population of both the Kusilvak (Wade Hampton) and Bethel Census Areas enrolled in Medicaid.
Although Alaska is now an expansion state, it did not expand its Medicaid program immediately after passage of the ACA. In August 2015, Governor Bill Walker issued an executive order to bypass the legislature (which resisted expansion initially). Since then, program enrollment has grown 68%, with 83,000 additional enrollees.
The effect on health centers has been profound. Medicaid is now the leading source of insurance for Alaskan health center patients, surpassing both private insurance and individual self-pay starting in 2016.
Amidst the growing number of Medicaid enrollees, some Alaskan lawmakers have expressed concern over rising costs associated with the increased enrollment. Alaska policymakers are currently exploring additional reforms to their state's program in an effort to control costs, including adding work requirements to enrollees and becoming the first state to accept federal funding in the form of a block grant.
Until very recently, Alaska's Medicaid program did not contract with any Managed Care Organizations (MCOs). In April, the state launched a three-year pilot with United Health Care to explore managed care in Anchorage and the Matanuska-Susitna Borough.
Idaho
In 2017, 297,688 Idahoans were enrolled in Medicaid. 27,796 (9%) of those patients went to a health center. The distribution of the Medicaid population is more evenly spread across the state compared to Alaska, although Canyon County and the more sparsely populated Clark County have approximately 25-30% of the entire population enrolled.
Idaho has not yet expanded Medicaid. Voters directed the state to expand the program by ballot initiative last year, and lawmakers did pass legislation in the most recently held legislative session that moves expansion forward. The legislation also includes work requirements for enrollees and a partial expansion provision that enroll adults eligible for expanded Medicaid in the ACA exchanges by default. It is uncertain whether CMS will approve either measure or if they will stand up in court to any legal challenge. that might results.
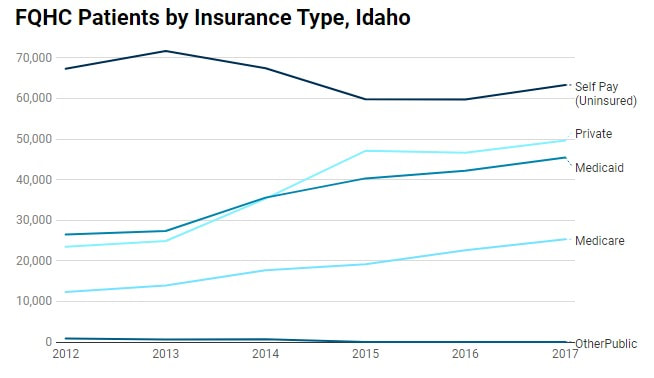
Despite not expanding Medicaid, health centers in Idaho are today serving more patients covered by Medicaid and private insurance than they were in 2012. The health exchanges set up by the ACA and the outreach and enrollment activities that it funded have reduced the overall number of health center patients without insurance. Self-pay is still the predominant type of payer method in the state, however, once Medicaid begins accepting new enrollees through expansion efforts, we expect the payer distribution in Idaho to resemble the other states in Region X.
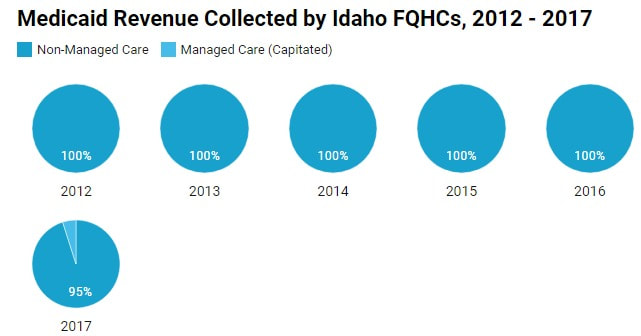
Medicaid patients in Idaho are not enrolled in an MCO, however, the state does operate Primary Care Case Management (PCCM) through its Healthy Connection Program. The program grants providers a small per-member-per-month fee to act as the primary home for patients. Recently, a few health centers in Idaho have reported some revenue from Medicaid through managed care, however, this is most likely revenue reported from health centers that serve patients in Oregon and/or Washington.
Oregon
In 2017, 976,182 Oregonians were enrolled in Medicaid. 218,604 (22%) of those patients went to a health center. With robust and long-standing outreach and enrollment activities, the Medicaid penetration rates are estimated to be more evenly distributed throughout the state, with the counties in the Southern, and Central regions having a greater percentage of the public enrolled. Malheur and Jefferson counties have the highest rates, with more than 30% of each county's population estimated to be covered through Medicaid.
In 2017, 976,182 Oregonians were enrolled in Medicaid. 218,604 (22%) of those patients went to a health center. With robust and long-standing outreach and enrollment activities, the Medicaid penetration rates are estimated to be more evenly distributed throughout the state, with the counties in the Southern, and Central regions having a greater percentage of the public enrolled. Malheur and Jefferson counties have the highest rates, with more than 30% of each county's population estimated to be covered through Medicaid.
Oregon was one of the states to expand Medicaid as soon as it was permitted by the ACA. Lawmakers had already taken measures in years prior to increase enrollment, so the decision to expand was met with little resistance from either the legislature or executive branch. Since then, program enrollment has increased by 56%, with approximately 350,000 new enrollees.
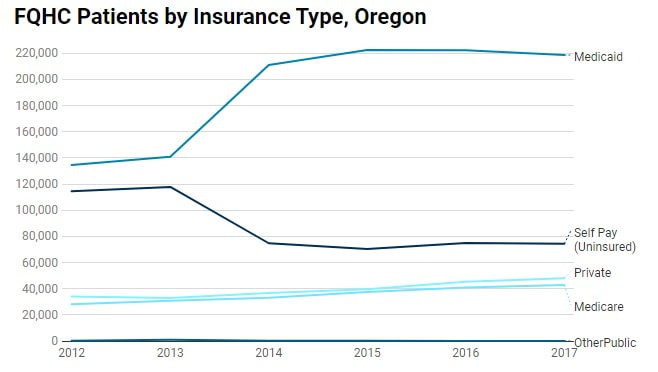
Health centers were already serving more patients covered by Medicaid than any other insurance type, however, expansion has further pushed that distribution to more extreme levels. Today, approximately 57% of all patients seen by health centers in Oregon are covered by Medicaid.
Health centers were already serving more patients covered by Medicaid than any other insurance type, however, expansion has further pushed that distribution to more extreme levels. Today, approximately 57% of all patients seen by health centers in Oregon are covered by Medicaid.
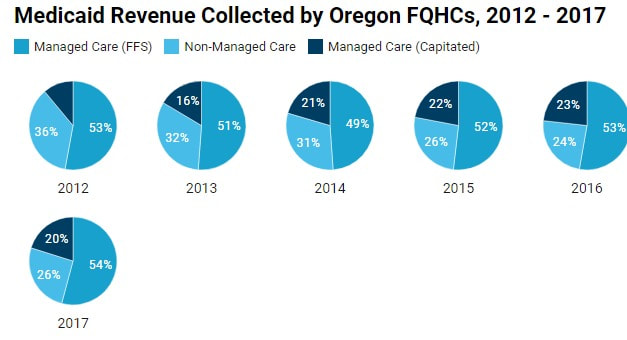
Oregon has instituted Medicaid Managed Care through its 16 Coordinated Care Organizations (CCOs), which oversee the delivery of care and reimbursement for enrollees that reside within a geographic area. The goal of this model is to improve the health outcomes for the entire Medicaid population by focusing on care coordination and value-based payment. To achieve this, many CCOs reimburse health centers for delivering care to their Medicaid patients via capitated or fee-for-service payment models. These payment models have become more relied on in recent years, with non-managed care payments accounting for only 26% of all payments in 2017.
Washington
In 2017, 1,782,832 Washingtonians were enrolled in Medicaid. 218,604 (22%) of those patients visited a health center. Medicaid penetration is greatest in the counties of the North and South Central regions, notably Adams and Grant Counties.
In 2017, 1,782,832 Washingtonians were enrolled in Medicaid. 218,604 (22%) of those patients visited a health center. Medicaid penetration is greatest in the counties of the North and South Central regions, notably Adams and Grant Counties.
Washington was an early adopter to Medicaid expansion, having already expanded its program by 1115 waiver beginning in 2011. At the time, the state funded the costs of the additional enrollees, so switching funding to Federal sources in 2014 was a no-brainer for lawmakers. The expansion has dramatically increased Medicaid enrollment numbers, with close 700,000 new patients joining the program since 2013.
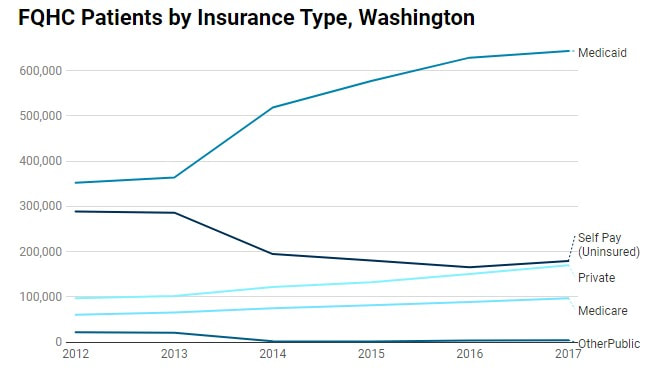
As with Oregon, Medicaid was already the largest insurance provider for Washington health center patients before the state officially expanded Medicaid as part of the ACA. Since then, the state's Medicaid population has grown dramatically, far surpassing estimates of analysts and policymakers. Today, Medicaid is the form of insurance for 58% of all health center patients.
As with Oregon, Medicaid was already the largest insurance provider for Washington health center patients before the state officially expanded Medicaid as part of the ACA. Since then, the state's Medicaid population has grown dramatically, far surpassing estimates of analysts and policymakers. Today, Medicaid is the form of insurance for 58% of all health center patients.
Also similar to Oregon, care for patients enrolled in Washington's Medicaid program is managed by MCOs. There are five different MCOs that operate in the state, though not all of them are available in each county. Integrated managed care (which covers primary care, mental health, and substance use disorder treatment) became available to Medicaid patients in most counties this year, with the remaining counties covered by January of 2020.
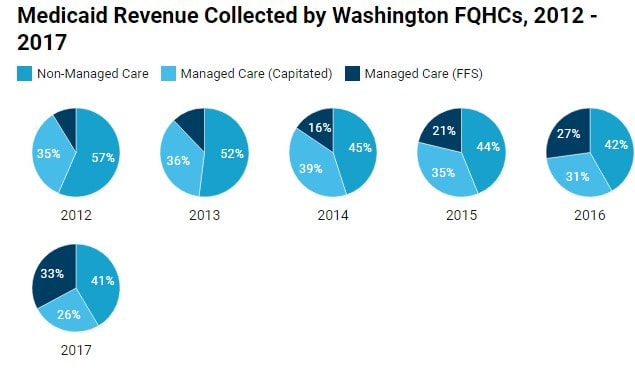
Washington is also aggressively moving towards value-based payments, with a goal of 90% of all payments linked to quality by 2021. Since 2012, the percentage of non-managed payments made to health centers on behalf of Medicaid has declined dramatically. Today, managed care payments account for more than half of all revenue received by health centers from Medicaid, with the biggest increases occurring in the managed care fee-for-service category.
Washington is also aggressively moving towards value-based payments, with a goal of 90% of all payments linked to quality by 2021. Since 2012, the percentage of non-managed payments made to health centers on behalf of Medicaid has declined dramatically. Today, managed care payments account for more than half of all revenue received by health centers from Medicaid, with the biggest increases occurring in the managed care fee-for-service category.
PCMH in Region X
Tuesday, August 6, 2019
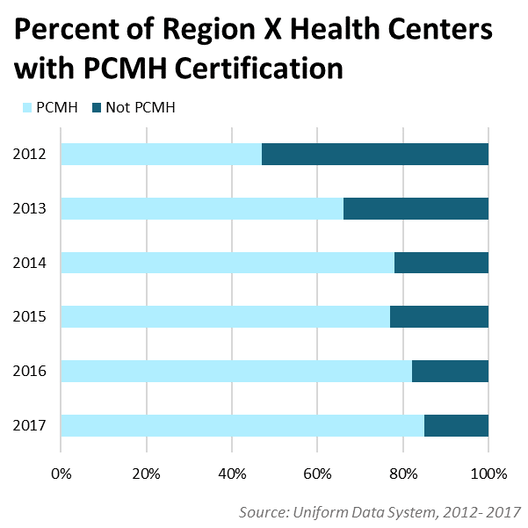
With an eye towards improving patient experience and health outcomes, since 2012 health centers in Region X have steadily adopted practices and standards that make them Patient Centered Medical Homes (PCMH). Today, 85% of all health centers across Alaska, Idaho, Oregon and Washington are officially recognized as medical homes.
With an eye towards improving patient experience and health outcomes, since 2012 health centers in Region X have steadily adopted practices and standards that make them Patient Centered Medical Homes (PCMH). Today, 85% of all health centers across Alaska, Idaho, Oregon and Washington are officially recognized as medical homes.
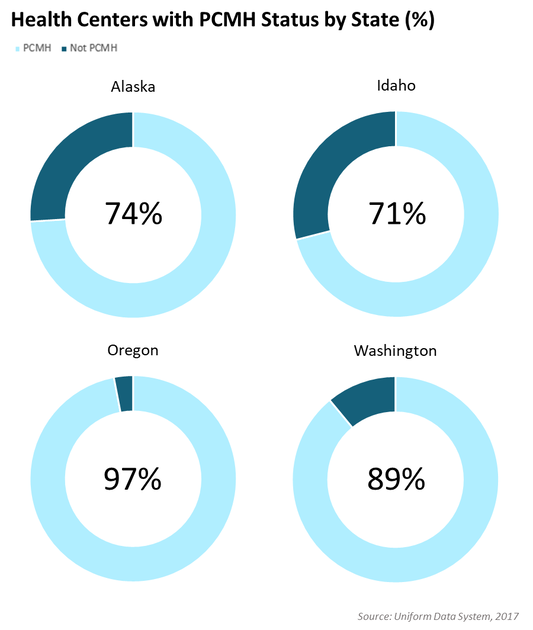
The growing adoption of PCMH recognition has not just been limited to health centers in Region X. Nationally, 74% of all CHCs had achieved PCMH recognition by 2017. But with three of the four states in Region X having PCMH rates higher than the national percentage, the Northwest region has been a consistent leader in this area, with more widespread and faster adoption
Health centers officially earn recognition by meeting the certification requirements of one or more accrediting agencies. The requirements vary per accrediting body, but, broadly speaking they tend to address five critical functions of medical homes identified by the Agency for Healthcare Research and Quality (AHRQ):
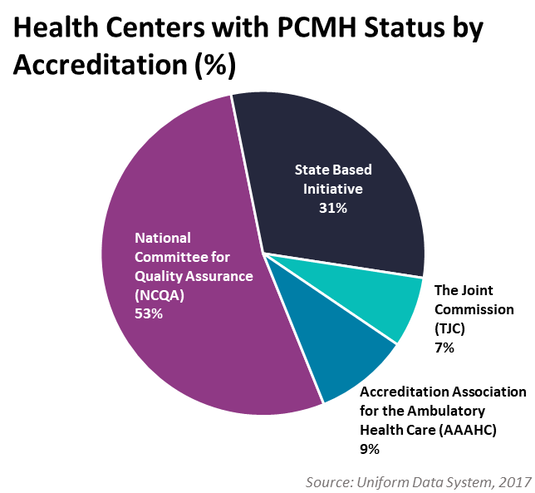
In Region X, the majority of health centers achieve accreditation through the National Center for Quality Assurance (NCQA), however a significant number of health centers in Oregon have achieved certification through the Oregon Health Authority’s program.
- Comprehensive Care: the clinic must be able to respond to a large majority of physical and mental health needs, encompassing a diverse team of providers and services
- Patient-Centered: the clinic must provide care that is patient-centered, whole-person, and responds to the individual needs and circumstances (both cultural and physical) of each person.
- Coordinated Care: the clinic must coordinate patient care across the entire spectrum of the health care system, working seamlessly with specialty care, hospitals, and community services.
- Accessible Services: the clinic must have systems that make access to care easily accessible, including short wait times and telehealth options.
- Quality and Safety: the clinic must commit to quality improvement performance standards and evidence-based medicine.
In Region X, the majority of health centers achieve accreditation through the National Center for Quality Assurance (NCQA), however a significant number of health centers in Oregon have achieved certification through the Oregon Health Authority’s program.
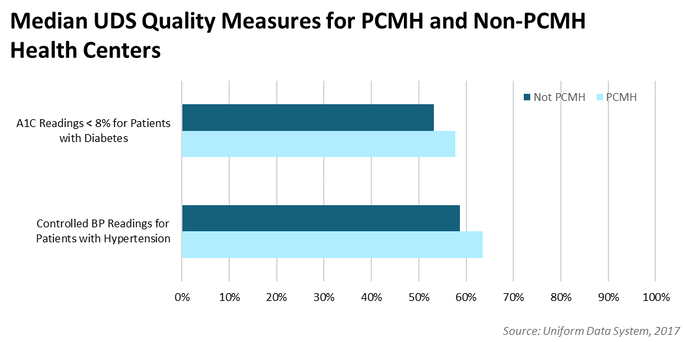
The hard work needed to achieve PCMH recognition is well worth it. There is ample evidence that medical homes have lower total cost of care and better health outcomes for their patients. And PCMH status among FQHCs has been shown to be associated with higher rates of diabetes and hypertension control, a trend that we’ve seen among Region X health centers.
As a critical component of healthcare reform, the drive towards PCMH is revitalizing primary care across the United States. Health centers have been at the forefront of this movement, ensuring that our most vulnerable and underserved patients have a medical home.
Good Health in Region X: Part 1
Tuesday, November 19, 2019
Written by: Alexcia Devasquez, Data & Information Specialist, NWRPCA
Written by: Alexcia Devasquez, Data & Information Specialist, NWRPCA
With Diabetes Awareness Month we see an emphasis on healthy eating and diet education regarding diabetes type 1 and 2. In Data Points we will look at the data that has been collected regarding our consumption, obesity statistics, and how well we are doing as a region to have these conversations with our patients.
The Nation’s Administration and Agencies have noticed the importance of tracking the number of people who are diagnosed and treated for diabetes and hypertension; and because they recognize obesity as one of the medical contributing factors to an increased risk of both, they have increased tracking on this as well. HRSA, through the UDS report, tracks 20 data points regarding diabetes and prevalence by ethnicity, 40 data points regarding hypertension and ethnicity, and 10 data points regarding obesity, 6 of which are broken down by age. When HRSA is tracking the prevalence of obesity, they are also tracking the documented conversations we are having with our patients about BMI and nutrition. In the Clinical Measures from the UDS data, they compare percentage of children and adolescents with documented counseling and BMI percentile and number of children and adolescents with documented counseling and BMI percentile while with adults they examine the percentage of Adults with Follow up Plan.
In investigating this data, I realized these percentages don’t speak to how many adults and children are being screened. They are asking health centers to report how many patients who have been counseled have a plan. When we look at the number of patients reported by health centers in Region X in the age range 3-17, and how many of them are being talked to about BMI and nutrition, we see that health centers report that they talk to 69% of our children about nutrition and BMI and follow up with about 28% who are not in the BMI normal range. When we look at adult patients, we see that health centers report that they talk to 79% of their adult patients and have a follow up plan with 39%.
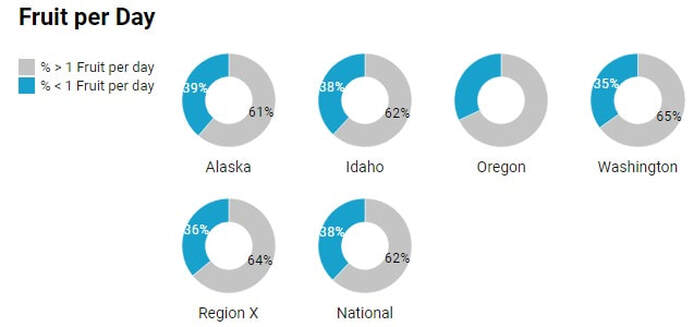
The CDC has multiple tools on their site that show our national statistics regarding diabetes, obesity of both adults and children, and studies regarding our nutrition and consumption of food. The CDC states that most Americans don’t get their recommended daily servings of fruits and veggies but their study shows that the majority of Americans don’t get more than two serving of fruits and veggies a day let alone the suggested 5 servings. Their study shows that 37.9% of Americans get more than one serving of fruit a day and 22.5% get more than 1 serving of veggies a day. This means 62.1% of Americans have one or fewer servings of fruit a day and 78.5% of Americans are getting 1 or fewer servings of veggies a day. In our Region, we fall a little lower than the national average with 82% of people getting one or fewer vegetable serving per day.
These statistics suggest that helping health center patients make a plan about healthy eating should be a nearly universal goal – not just with patients who are already obese, but with patients who are not yet obese, but may not have access to and/or be eating a health-supporting diet.
Good Health in Region X: Part 2
Tuesday, December 17, 2019
Written by: Alexcia Devasquez, Data & Information Specialist, NWRPCA
Written by: Alexcia Devasquez, Data & Information Specialist, NWRPCA
Last Month we introduced Good Health in Region X during Diabetes Awareness Month which is a three part series addressing factors related to health and how we can support the underserved in providing better health.
We discussed the facts that most Americans are not having more than one serving of fruits or more than two servings of vegetables per day and how we are doing in talking to all of our patients about healthy diets, you can read more about it here.
This month, we will discuss access, as census study showed that they expect that 70% of people will be buying food online by 2025. We are seeing a specific change of how people purchase food with Amazon launching low-cost versions of Prime to EBT card holders and Medicaid Patients. Amazon is one of the larger grocery chains that is partnering with the USDA lead program working to get food delivery services to people with EBT cards. The USDA program is a pilot program which started in 2016 and was only available in three states, although, earlier this year they announced they expansion into seven states. This expansion includes two states in Region X, Oregon and Washington. The retailers confirmed in the pilot in Region X are Amazon, Walmart and Safeway. Safeway offers EBT delivery for people with disabilities, Walmart allows for EBT purchases for pickup, where Amazon is piloting their program in New York, it applies to items that are delivered as customers are able to put EBT benefits on their Amazon Cash accounts.
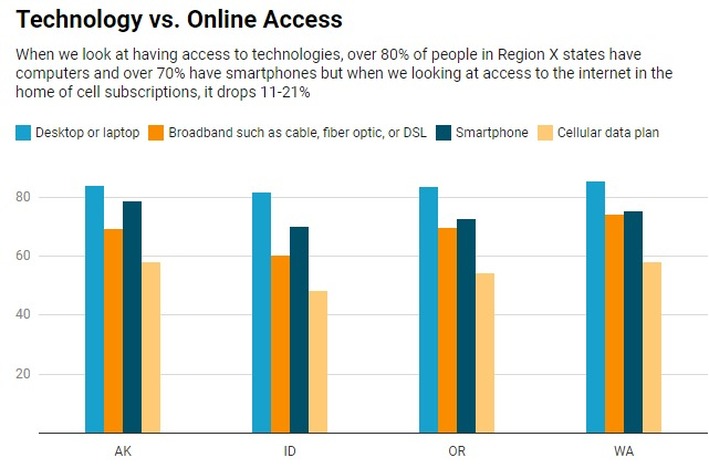
Having the programs available to the public is the first step, next is getting the programs into the hands of those who need them. According to the US Census, more than 80% of people in Region X have computers, desktops or laptops while internet access is not as consistent, while approximately 60-70% of people have cellphones but not necessarily have a cellular plan. Many of these folks, if they are using and carrying their cellphone with them, are dependent on Wi-Fi within the community or possibly associated with their home internet plan.
As we know the importance of having Food Prescriptions, and the struggle of getting food into the hands of our residents or patients, how are we able to get internet access to those who need? Can we provide WiFi at our locations? Possibly provide a separate log-in for using online services specifically? Provide computers and staff who can help people set up online accounts or schedule pickups with those large grocers who do accept EBT? Once people have a better idea of how to shop and cook healthy, what can we do to assist in getting the food to their table?
Sources:
https://www.census.gov/library/stories/2018/12/rural-and-lower-income-counties-lag-nation-internet-subscription.html
https://www.census.gov/acs/www/data/data-tables-and-tools/narrative-profiles/
Sources:
https://www.census.gov/library/stories/2018/12/rural-and-lower-income-counties-lag-nation-internet-subscription.html
https://www.census.gov/acs/www/data/data-tables-and-tools/narrative-profiles/

