Region X Health Centers Serve a Greater Share of the Public
Tuesday, April 10, 2018
Posted by: Thomas Johnson
Posted by: Thomas Johnson
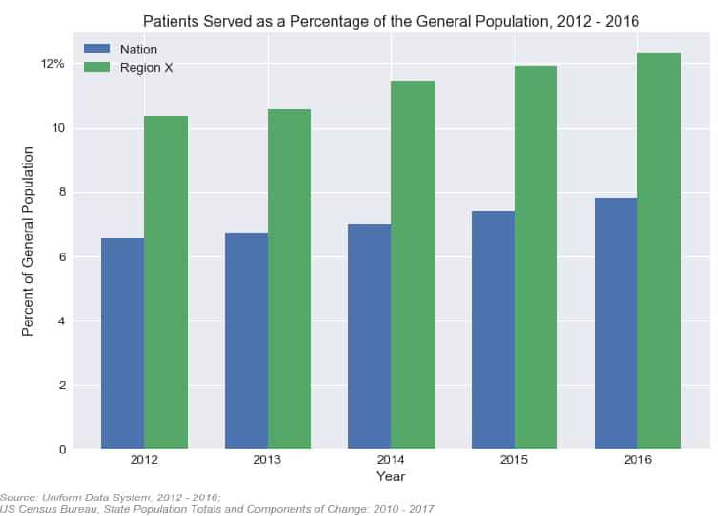
Since 2012, health centers across the nation have steadily increased their patient populations, serving 22% more patients in 2016 than they did just four years earlier. Health centers in Region X are no different. The number of health center patients served in Alaska, Idaho, Oregon, and Washington increased from 1,359,042 in 2012 to 1,703,473 in 2016.
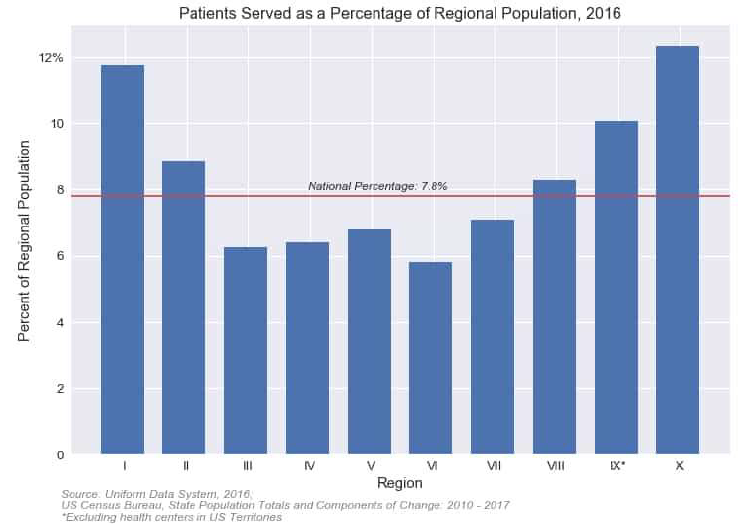
What makes Region X unique from the other HHS regions is the per capita rate of patients served. Nationally, approximately 8% of the general population were served by health centers in 2016. In Region X states, however, approximately 12% of the population were served by health centers.
That means that health centers in Region X serve a greater share of the public than any of the other HHS regions.
At the individual state level, all four of states in Region X have higher than average percentages of the public using health center services, something that's been in effect since at least 2012.
The findings come from the annual Uniform Data System reports that health centers submit to HRSA each year and US Census population estimates. Because some patients can be treated by different health centers and because some health centers serve patients residing outside their state, the numbers are just estimates.
Nonetheless, they attest to the extraordinary efforts of Region X health centers in bringing affordable care to more members of their communities.
How Many Rural Health Centers are there in Region X?
Monday, May 14, 2018
Posted by: Thomas Johnson
Posted by: Thomas Johnson
Last month, we kicked this column off by looking at the number of patients served as a percent of the general population. The general question that article attempted to answer was "How many people in a given state are health center patients?"
This month we're shifting gears and focusing on the question of rurality. More specifically, "How many health center service delivery sites in Region X are located in rural areas?"
Fortunately, we can get around this issue by reclassifying each site's facility setting using an alternative classification system. The map below, for example, shows the percentage of health center sites in each state that are eligible for grants awarded by the Federal Office of Rural Health Policy (click here to read more about their classification criteria).
Joining FORHP's classification with HRSA's site directory provides a clearer picture of how many delivery sites are located in rural areas. With a few exceptions, most states with a high percentage of rural sites are concentrated in the Southeast and Midwest. In Region X, the states with the greatest share of rural delivery sites are located in Idaho and Alaska, the latter of which has the highest percentage of rural sites throughout the country.
The map also shows the degree of misalignment between HRSA's designation and FORHP's designation. For many states, the percentage of rural health center sites is actually greater than what HRSA's site directory indicates. For health center staff, this means that regardless of how HRSA classifies your health center's delivery locations, you should still check each site's address using FORHP's Rural Health Grants Eligibility Analyzer. You may be eligible for a grant and not realize it!
The other benefit of using FORHP's classification is that it lets us answer the closely related question of "What percent of each health center's patient population live in a rural community?"
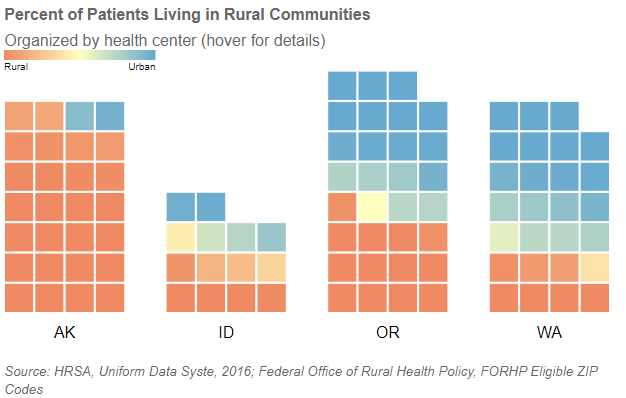
In the chart below, each health center in Region X is represented by a square. The color corresponds to the percentage of patients living in a rural postal code (as determined by FORHP). Bluer squares represent health centers that serve more urban populations and redder squares represent health centers that serve more rural ones.
We typically think of health centers as being either completely rural or completely urban, and for Region X at least the data seems to bear this out. Most health centers in the chart are either a deep shade of red or a deep shade of blue. There are very few that serve both types of patients evenly (represented by the yellow squares). Even a health center like Sea Mar, which serves hundreds of thousands of patients across dozens of sites, serves a mostly urban population.
This degree of polarization highlights the importance of building partnerships between health centers that serve different types of populations. Nearby urban health centers may be able to provide services not readily available at sites serving rural populations.
This degree of polarization highlights the importance of building partnerships between health centers that serve different types of populations. Nearby urban health centers may be able to provide services not readily available at sites serving rural populations.
Electronic Health Records Platforms in Region X
Tuesday, June 19, 2018
Posted by: Thomas Johnson
Posted by: Thomas Johnson
Since incentivizing usage of Electronic Health Records (EHR) platforms among eligible providers and practices in the HITECH Act (passed as part of the 2009 stimulus package), adoption of EHR adoption among medical facilities has increased dramatically. In this article, we will use UDS data from 2012 through 2016 to provide a broad over of which EHR software platforms have seen the greatest adoption among Region X health centers.
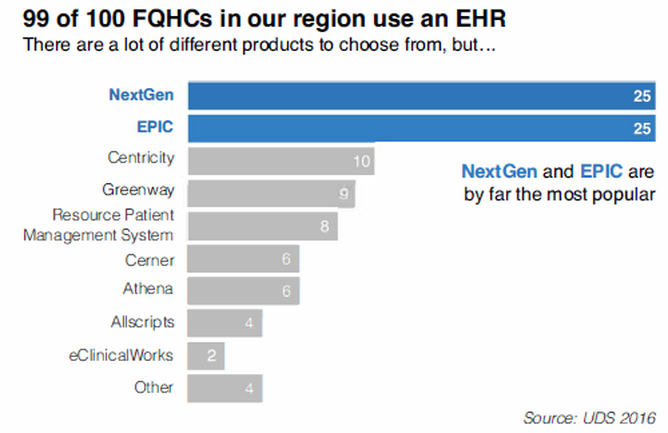
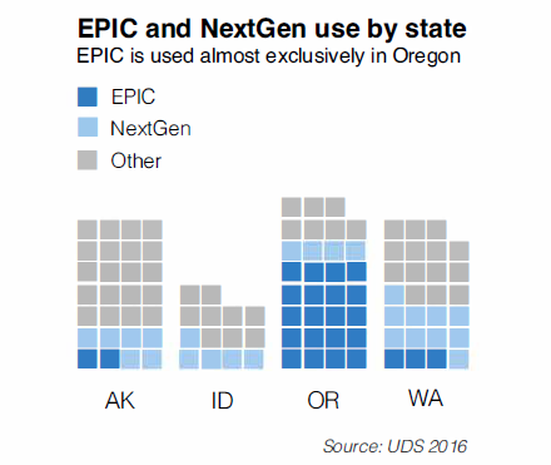
In 2016, 99 of 100 health centers in Region X reported having an EHR installed and in use among one or more sites. One health center reported not having an EHR installed, however, they indicated that they had active plans for adoption in 2017. For the health centers using EH Rs, NextGen and EPIC are by far the most popular software options, with each platform taking up approximately 25% of market share. Centricity and Greenway Health products are also popular choices, with each product in use by about 10% market share. Resource Patient Management System (RPMS)--provided by Indian Health Service--is also a popular choice among CHCs that serve American Indian or Alaska Native communities. Despite the equal popularity of both NextGen and EPIC, health centers using these two products do not have the same pattern of distribution among Region X states. NextGen is widely used throughout the entire region and appears to be a popular choice among health centers regardless of state.
EPIC, however, is heavily localized to Oregon, where it accounts for approximately 66% of the states FQHC market share (20 of 31 FQHCs). This no small part due to OCHIN (Oregon's HCCN), which provides as one of its most popular offerings a hosted EPIC instance. Outside of Oregon, however, EPIC adoption has not been as widespread. In 2016, only two Alaska health centers and three Washington health centers reported adoption. No health centers in Idaho reported using it among their facilities. Beyond NextGen and EPIC, most other EHR products were evenly spread throughout the four states with a few notable exceptions:
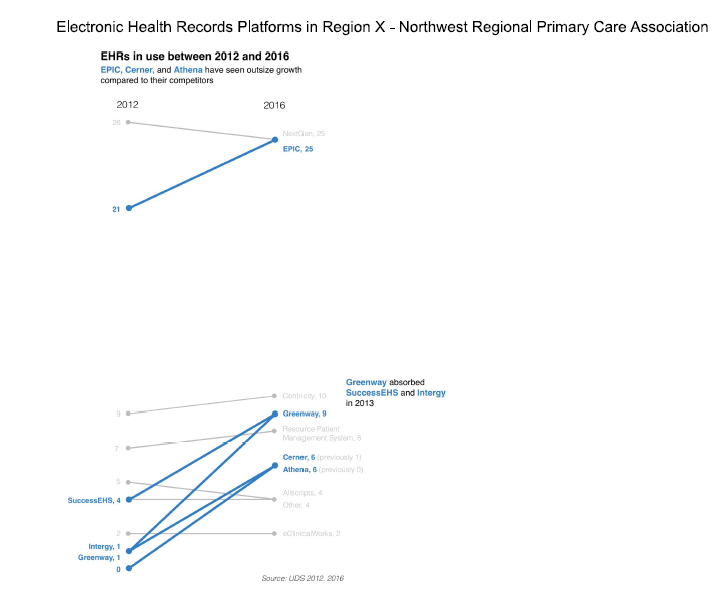
In terms of how EHR popularity has changed since 2012, EPIC, Cerner, and Athena Clinicals have seen significant increases in adoption. Greenway Health has also seen increased adoption among its suite of products after the company was formed in 2013 and acquired multiple longstanding platforms.
It is not common for health centers to change EH Rs after they have adopted one, so for most of these products, the increases in popularity are due to health centers adopting their product for the first time rather than migrating over from an existing EHR platform.
- In Alaska, Cerner and RPMS are especially popular, with each product in use by six and five health centers, respectively. It's worth noting that Cerner is only used by health centers in Alaska, where it ties NextGen for popularity.
- In Washington, Allscripts and Athena Clinicals also have a major presence with each product being used by four health centers. Despite their popularity, NextGen is still the dominant product.
- In Idaho, the collected platforms offered by Greenway Health (ie, SuccessEHS, PrimeSuite, and lntergy) hold significant market share.
In terms of how EHR popularity has changed since 2012, EPIC, Cerner, and Athena Clinicals have seen significant increases in adoption. Greenway Health has also seen increased adoption among its suite of products after the company was formed in 2013 and acquired multiple longstanding platforms.
It is not common for health centers to change EH Rs after they have adopted one, so for most of these products, the increases in popularity are due to health centers adopting their product for the first time rather than migrating over from an existing EHR platform.
2018 Training Needs Survey
Tuesday, July 17, 2018
Posted by: Thomas Johnson
Posted by: Thomas Johnson
Every year, in coordination with CHAMPS (Community Health Association of Mountain/Plain States), NWRPCA distributes a Training Needs Survey to health center staff throughout Alaska, Idaho, Oregon, and Washington. The purpose of the survey is to request guidance about the areas that NWRPCA and the state primary care association need to focus on in providing training and technical support to FQHCs in our region.
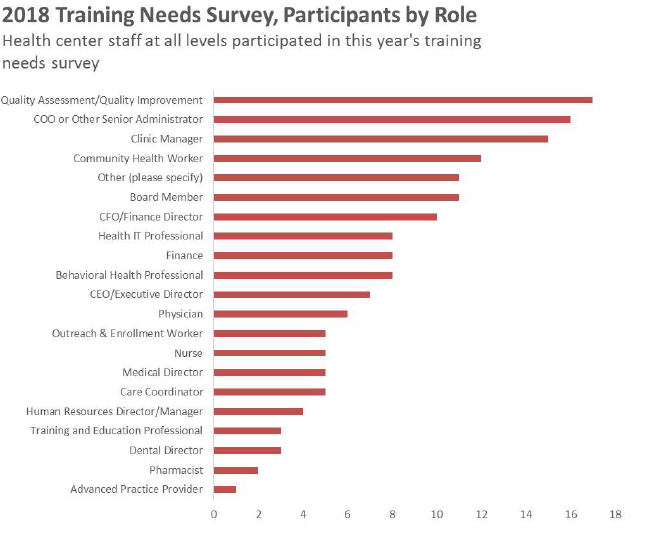
This year, the survey was conducted in April. More than 160 people participated, with respondents varying widely in terms of both state and the role they serve at their health center. In particular, there was excellent participation from QA/QI professionals, providers and advance practice providers, CHWs and outreach/enrollment staff, and executives and other key decision makers. Respondents who selected the Other category were administrative support professionals, coaches, and miscellaneous program/project managers.
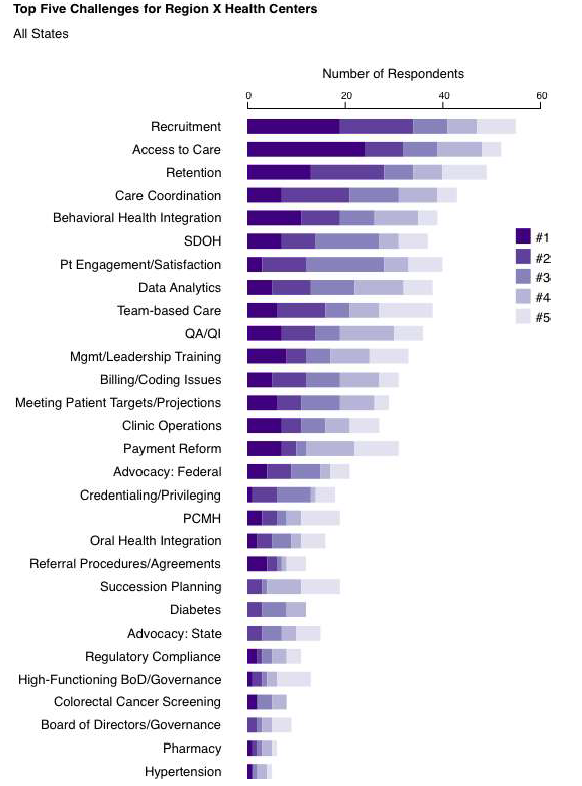
One of the most important questions respondents completed asked them to select and rank the top five challenges their health center faces from a list of topics/focus areas. As with past training needs surveys, Recruitment, Access to Care, and Retention were identified as major challenges throughout the region. In Idaho, respondents also indicated that social determinants of health and patient engagement were top challenges, while Oregon participants also emphasized data analytics and behavioral health integration (click the smaller images below to see individual states).
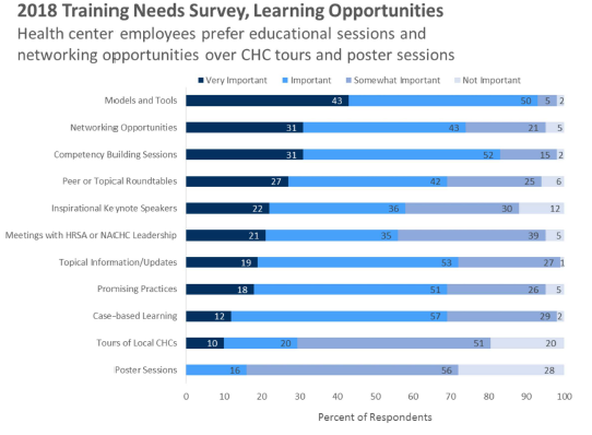
Respondents were also asked to rank which type of learning opportunities they found most valuable at NWRPCA conferences. Networking opportunities and sessions that address models and tools were highly valued, while poster sessions and tours of local community health centers were primarily identified as only somewhat important or not important at all.
These survey responses are immeasurably value to NWPRCA, and they go a long way to helping us shape the content of conferences, standalone trainings, webinars, and beyond. If you have any additional feedback that you would like to share with us, please feel free to reach out to our Membership Services Specialist, Georgia Mauney.
Telehealth Services in Region X and Beyond
Monday, August20,2018
Posted by: Thomas Johnson
Posted by: Thomas Johnson
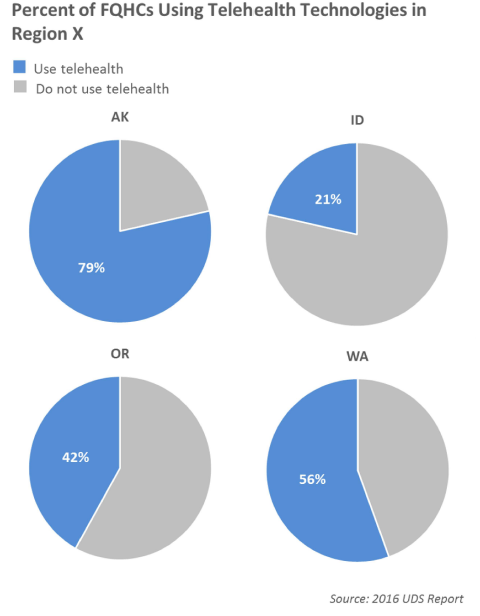
In 2017, HRSA began requesting that health centers report on whether they offer telehealth kind of services are offered to patients. In this month's Data Points column, we will explore telehealth usage in Region X and beyond.
The question was added to the Health Information Technology Form, which health centers report. HRSA defines telehealth as "the use of telecommunications and information technology and provide clinical care, education, public health, and administrative services at a distance technologies that fall under this definition include:
- Video Conferencing
- Internet-Based Communication
- Store-and-Forward Imaging
- Streaming Media
- and Terrestrial and Wireless Communications
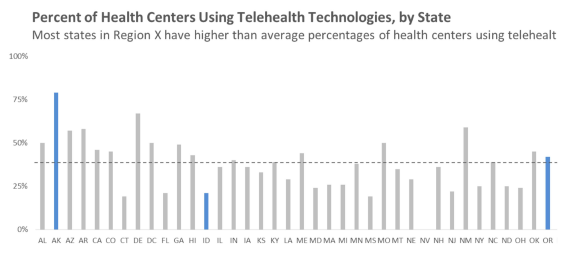
Nationally, only 39% of all health centers reported offering telehealth capabilities, meaning Region X are more likely to have telehealth services offered at their clinic than elsewhere.
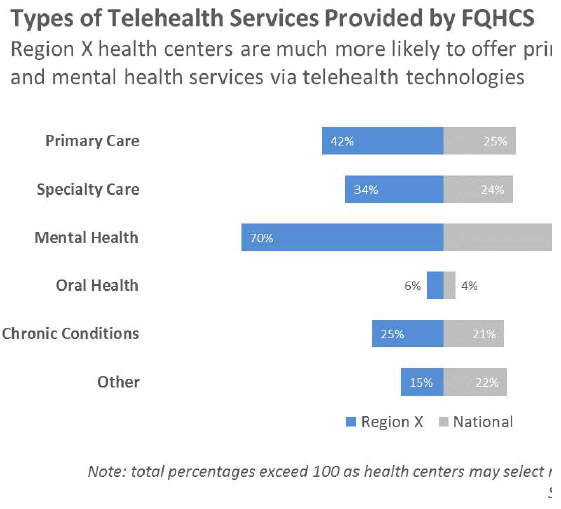
As you can see, Region X are leaders when it comes to telhealth technology. If your health center is doing something particularly innovative and you would like to share your experiences at one of our conferences, please reach out to us at [email protected].
Substance Use Disorder Treatment in Region X
Monday, September 17, 2018
Posted by: Thomas Johnson
Posted by: Thomas Johnson
Last September, HRSA awarded $200 million in supplemental funding to health centers across the nation to increase access to substance abuse and mental health services in an effort to help fight the opioid overdose crisis. $14 million was distributed to 83 health centers in Region X. In this article, we will summarize how Region X health centers have expanded their services to help combat this epidemic.
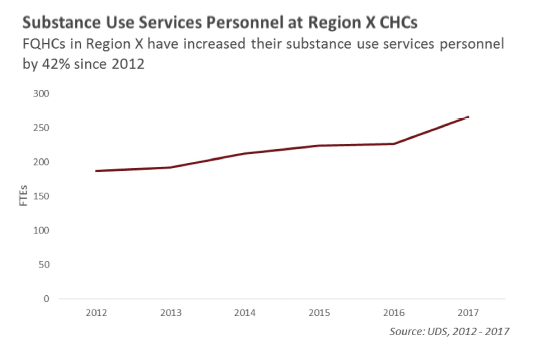
Throughout the region, FQHCs have steadily hired more employees to provide patients with alcohol or drug abuse counseling and/or treatment services. Today, there are 42% more substance use services personnel working at CH Cs than there were just five years ago.
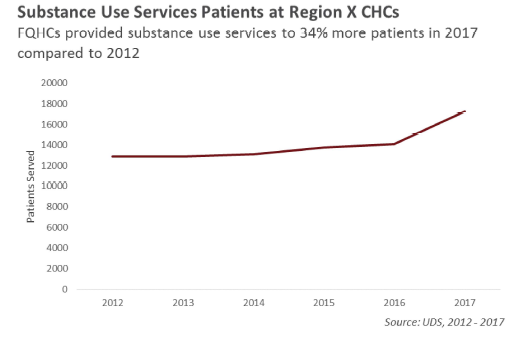
Matching this rise in personnel has been an increase in the total number of patients receiving substance use services. Last year health centers provided substance use services to 34% more patients than in 2012. The biggest increase in patients served occurred in 2016, when health centers provided assistance to more than 3,000 additional patients compared to the year prior.
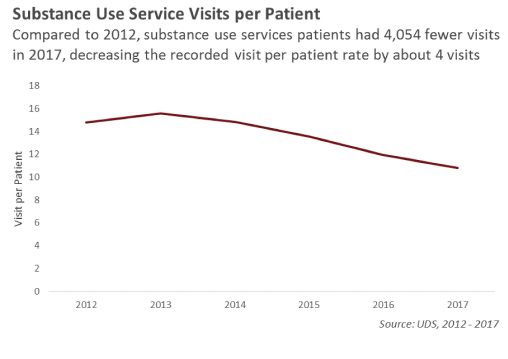
Despite the increase in patients and personnel, the total number of substance use visits has actually decreased from 190,582 in 2012 to 186,528 in 2017. With the considerable increase in patients, this means that the rate of visits per patient has noticeably declined in the past five years.
This change in visits per patient could be attributable to health centers more regularly referring patients to outside specialists or adoption of new treatment delivery techniques that are recorded differently in their UDS report (telehealth delivery, group sessions, increased utilization of behavioral health peers).
This change in visits per patient could be attributable to health centers more regularly referring patients to outside specialists or adoption of new treatment delivery techniques that are recorded differently in their UDS report (telehealth delivery, group sessions, increased utilization of behavioral health peers).
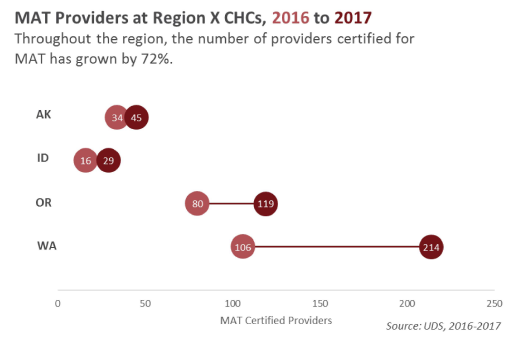
In 2016, HRSA awarded $94 million to health centers nationwide to expand substance abuse services and, in particular, to increase the number of patients with access to MAT for opioid use and other substance use disorders. 24 health centers in Region X received grants as part of this program, and as a result there are more health-center employed providers eligible to provide MAT services than ever before.
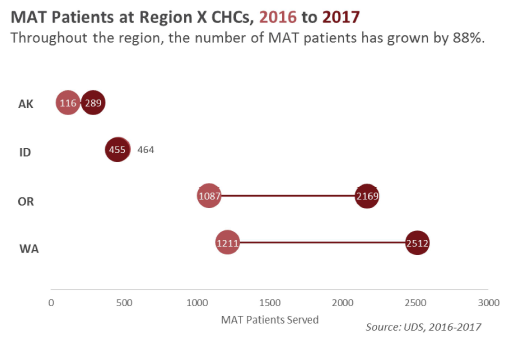
Last year, these clinicians provided MAT to a combined total of 5,425 patients in Region X. That's 88% more patients served than in 2016, when health centers provided MAT to 2,878 patients.
As the opioid crisis continues to affect communities throughout Region X and beyond, FQHCs have continuously shown that they are committed to fighting opioid addition and overdose through evidence-based practice. If your health center has implemented any particularly innovative programs, we would love to hear about your experiences!
Medicaid Patients in Region X Before and After Expansion
Monday, October 15, 2018
Posted by: Thomas Johnson
Posted by: Thomas Johnson
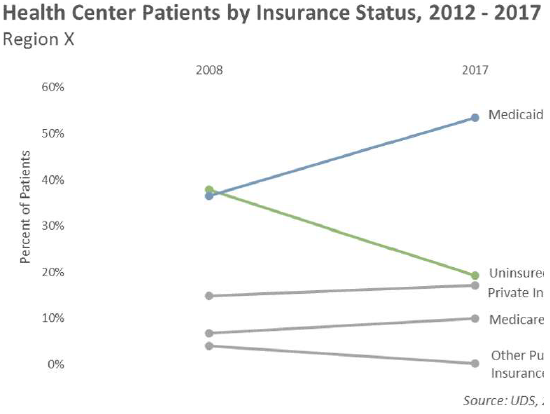
Since the passage of the Affordable Care Act (ACA), health centers in Region X have experienced a dramatic increase in the volume of patients served by Medicaid. In 2012, Medicaid patients for approximately 35% of all patients served by health centers throughout Alaska, Idaho, 0 Washington. Compare that to last year, when more than half of all health center patients in were insured through Medicaid.
This increase is directly related to the expansion of Medicaid, a signature component of the three of the four Region X states has expanded coverage of their state run program. Oregon Washington were early to accept federal funding for Medicaid expansion when it became a· states in 2014. In the years immediately prior, both states had each taken different approach increase coverage beyond what was mandated by the federal government. Alaska expanded under their program in 2015, granting eligibility to 42,000 more people. Idaho has yet to ex Medicaid, however an initiative to expand coverage will be on the 2018 ballot.
Unsurprisingly, the rise in Medicaid coverage has also resulted in health centers seeing few patients without insurance. Today, health centers in Region X serve about 20% fewer patients they did five years ago. While some of this decline has to do with more patients purchasing insurance coverage through their state's health insurance marketplace, the decline is largely attribute, patients becoming newly eligible for coverage under Medicaid.
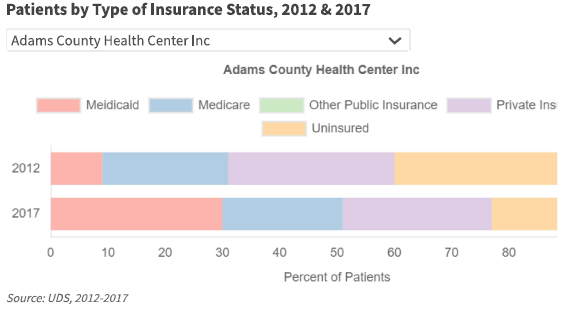
Curious about how patient coverage has changed at your own clinic? Use the chart below and see how the breakdown in insurance coverage has changed from 2012 to 2017.
Region X Health Centers and Medication Assisted Treatment (MAT)
Friday, November 16, 2018
Posted by: Thomas Johnson
Posted by: Thomas Johnson
In the September issue of Northwest Pulse, I devoted this column to exploring how health centers have collectively responded to the opioid overdose crisis. In this article I'm going to focus on a substance use treatment option that many health centers have brought to their to their patients: Medication Assisted Treatment (MAT).
MAT refers to the practice of treating substance use disorder with a combination of counseling, behavioral health therapies, and medication that helps patients manage the withdrawal symptoms and prevent opioid overdose. Medications that fall within this category include Buprenorphine (and naloxone, which helps reverse the effects of overdose), Methadone, and Naltrexone. When combined with a treatment plan that includes counseling or behavioral help therapies, MAT.
Many patients struggling with opioid addiction prefer Buprenorphine because it can be prescribed by a qualified physician and self-administered in an outpatient setting (as opposed to Methadone, which must be performed in structured, clinical environment). Not all physicians are able to write prescriptions, however. Providers must receive a federally granted waiver that requires completion of an eight-hour course and limits the number patients that may be treated. In 2016, the federal government increased the number of prescriptions providers could write to 275 to help combat the opioid overdose crisis, but many patients still struggle to get prescriptions.
Starting in 2016, HRSA began asking health centers on their UDS report to record how many providers at their clinic are certified to prescribe Buprenorphine and how many patients those providers issued prescriptions to within the reporting period. The resulting data reveals that most health centers are expanding their services in this direction, encouraging more staff to complete the federally mandated training and increasing the patient volume at their MAT programs.
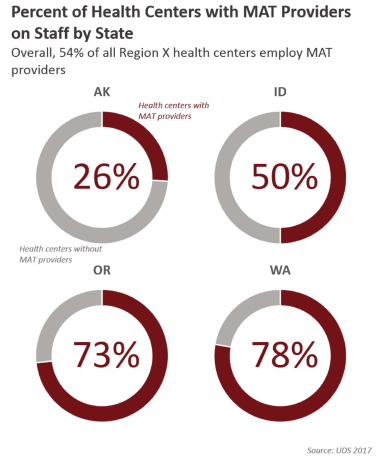
Last year most health centers in our region reported having MAT certified providers on staff. This rate is not evenly spread across the region. About threequarters of the health centers in Washington and Oregon, half of the health centers in Idaho, and only one-quarter of the health centers in Alaska employed MAT providers in 2017.
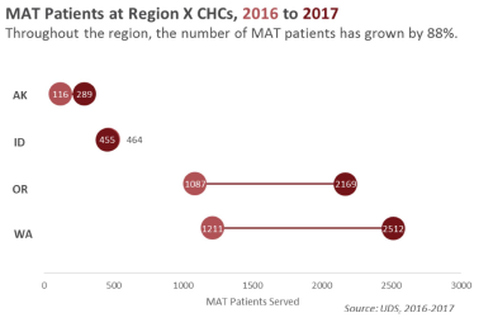
Despite the uneven spread, growth in MAT patient volume is considerable, with providers seeing 88% more of these patients in 2017 than in 2016. Alaska health centers experienced the biggest relative growth to their programs, with patient volume increasing by 175%, but Oregon and Washington health centers saw the largest increase in number of patients served. Collectively, the health centers in both states saw over 1,000 more patients in 2017, doubling their patient volume of their programs. The only state where health centers did not see more MAT patients was Idaho, where patient volume actually declined by 2%.
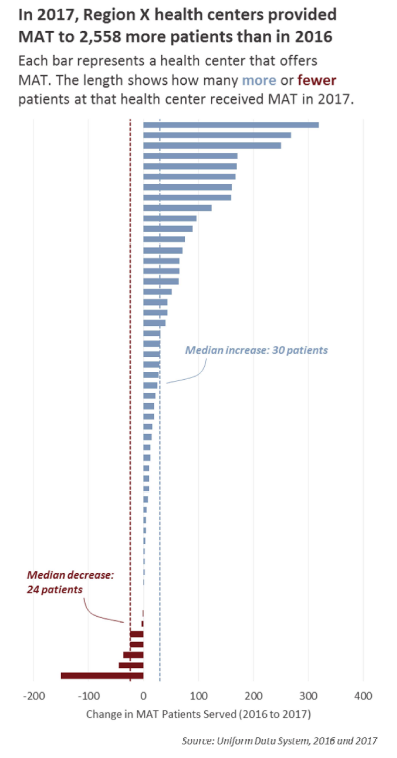
So far these numbers reflect state and regional totals. What does this growth look like at the health center to health center level? Of the 54 health centers with MAT programs, 83% experienced growth in those programs in 2017, on average seeing 30 more patients than in 2016. The growth for some health centers, however, greatly exceeded that number. One center, for example, increased their program from 67 patients in 2016 to 387 patients in 2017, making it the third biggest in the region. That's a huge increase given that the average size throughout the region is 69 patients (up from 36 in 2016).
A few health centers did not expand their program, with seven providing MAT to fewer patients in 2017 than 2016.
A few health centers did not expand their program, with seven providing MAT to fewer patients in 2017 than 2016.
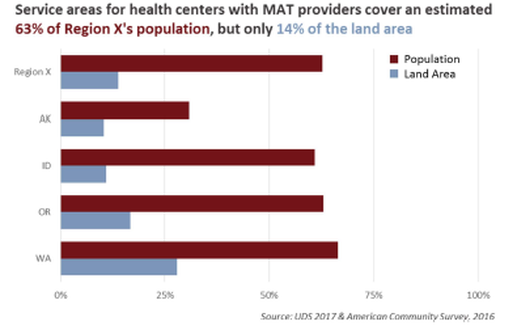
Geographically speaking, an estimated two-thirds of the population in Region X live within the service area of a health center that employs MAT certified providers. Collectively these service areas account for only 13% of the entire land area in the region, suggesting that MAT providers are mostly situated in urban health centers. If this is true, it's especially unfortunate as drug overdose deaths are higher in rural areas than urban ones. This is an important topic, and we'll provide more information (including maps!) in a future article.
It's clear from the data that many health centers in Region X are seeking to include MAT as an available treatment option. NWRPCA is committed to helping health centers expand their substance use programs to address the ongoing opioid overdose crisis via MAT or other practices.

